
Markets in a Minute
U.S. Dollar Performance After U.S. Elections
This Markets in a Minute Chart is available as a poster.
U.S. Dollar Performance After U.S. Elections
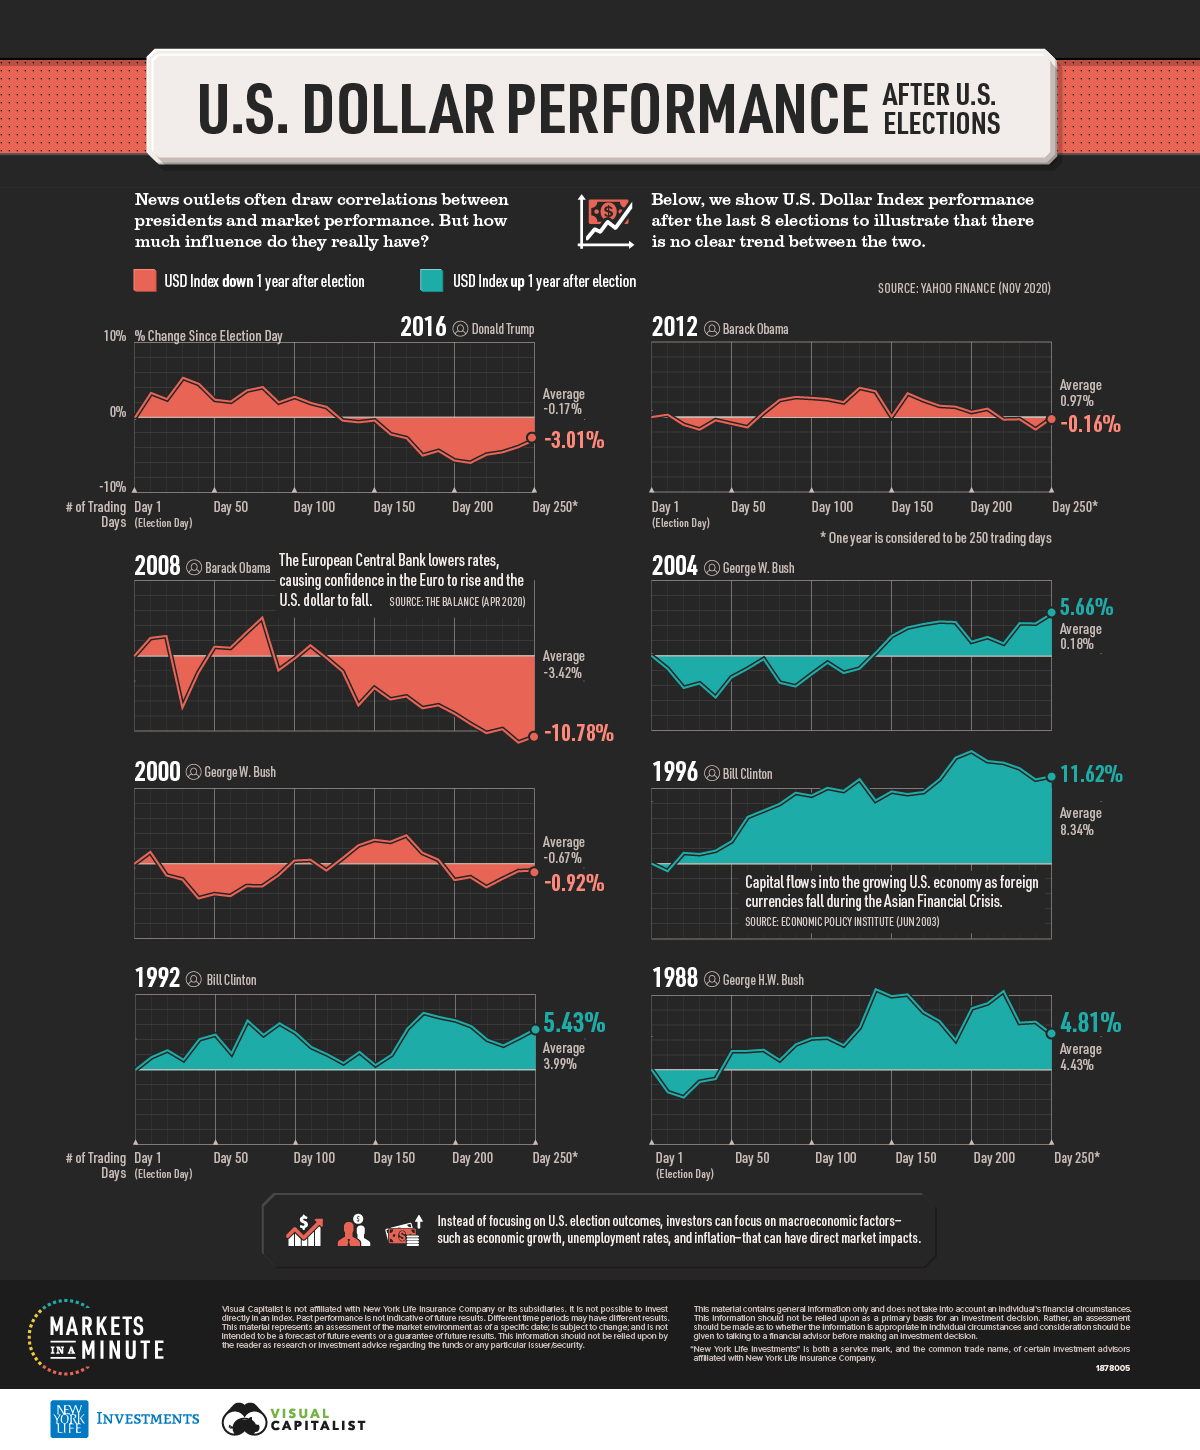
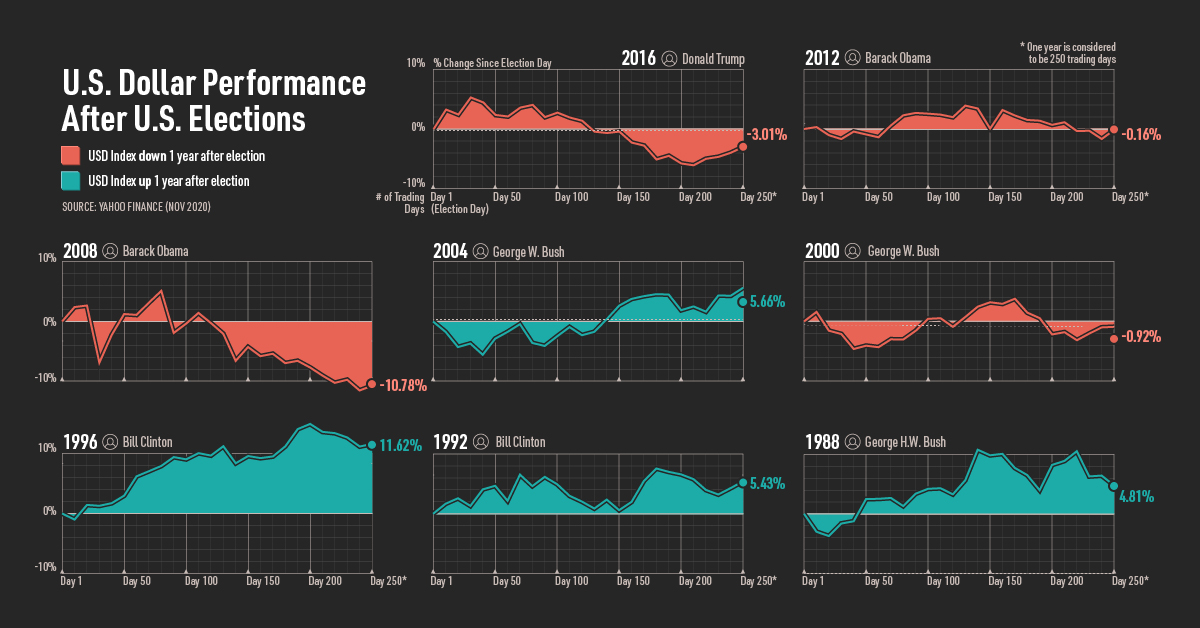
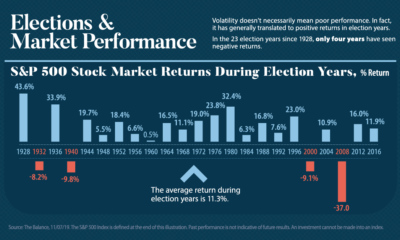
News outlets often draw correlations between U.S. elections and market performance. In turn, some investors opt for more conservative portfolios until the election uncertainty is overcome. But how much influence do elections really have?
In this Markets in a Minute from New York Life Investments, we show U.S. dollar performance after U.S. elections to illustrate that there is no clear trend between the two.
What is the U.S. Dollar Index?
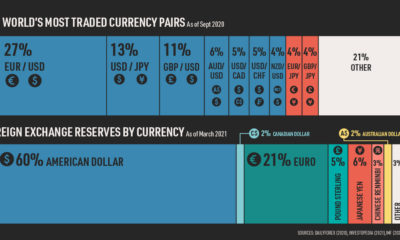
To start, we used the U.S. Dollar Index to track performance, which measures the U.S. dollar relative to a basket of six currencies.
| Currency | Weight |
|---|---|
| Euro | 57.6% |
| Japanese Yen | 13.6% |
| British Pound | 11.9% |
| Canadian Dollar | 9.1% |
| Swedish Krina | 4.2% |
| Swiss Franc | 3.6% |
Source: Intercontinental Exchange
Any changes in these respective currencies can affect the performance of the U.S. dollar.
Post-Election Performance
For each U.S. election from 1988 to 2016, we calculated the U.S. dollar index’s percentage change since election day. Changes were tracked over the course of a year, or 250 trading days.
There was no clear trend in U.S. dollar performance after U.S. elections. Here’s another look at the data, this time showing the range in changes over the year and percentage change at the end of the period.
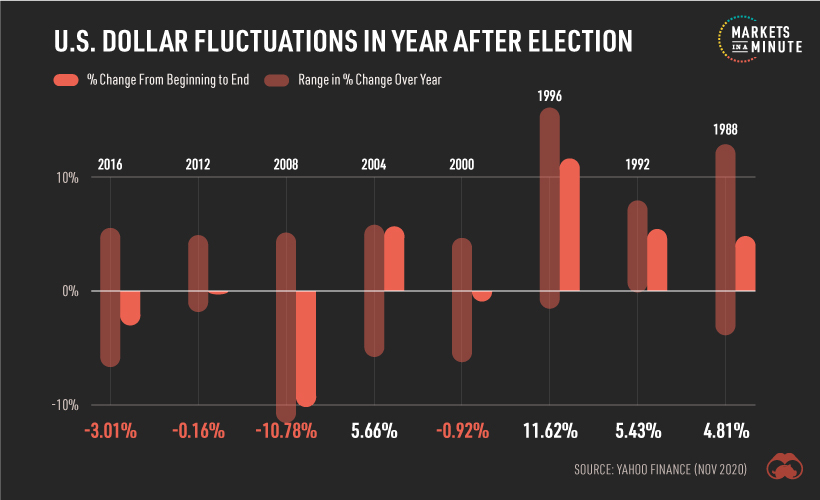
The U.S. dollar finished up in four years, and down in the other four years. The years after the 1988, 1996, and 2008 elections saw the largest fluctuations in values.
In 1989, the U.S. dollar surged due to three factors:
- High interest rates, which attracted foreign investment
- Political instability in West Germany and Japan
- Strength of American stock and bond markets
In the period after the 1996 election, the dollar climbed again. While foreign currencies collapsed amid the Asian financial crisis, the U.S. economy enjoyed rapid growth and was seen as a safe haven for investors.
On the flip side, the U.S. dollar saw significant declines in the year after the 2008 election. The European Central Bank lowered rates in response to the global financial crisis, raising confidence in the euro and causing the U.S. dollar to fall.
What Investors Can Focus On
In each case above, significant movements were caused by macroeconomic factors, rather than the outcome of the U.S. election.
Here are a few factors that can have a direct impact on market performance:
- Inflation decreases the value of a dollar over time. Investors should consider how prevailing interest rates compare to inflation, and look for assets that build wealth over time.
- Unemployment rates have widespread impact. When unemployment is high, economic output and consumer spending are reduced.
- Economic growth signals healthy demand, and may boost corporate profits and drive up asset prices.
While elections can cause investors to change their asset mix, it’s important for investors to focus on long-term, broader factors that directly influence the market.


Markets in a Minute
The Top 5 Reasons Clients Fire a Financial Advisor
Firing an advisor is often driven by more than cost and performance factors. Here are the top reasons clients ‘break up’ with their advisors.

The Top 5 Reasons Clients Fire a Financial Advisor
What drives investors to fire a financial advisor?
From saving for a down payment to planning for retirement, clients turn to advisors to guide them through life’s complex financial decisions. However, many of the key reasons for firing a financial advisor stem from emotional factors, and go beyond purely financial motivations.
We partnered with Morningstar to show the top reasons clients fire an advisor to provide insight on what’s driving investor behavior.
What Drives Firing Decisions?
Here are the top reasons clients terminated their advisor, based on a survey of 184 respondents:
| Reason for Firing | % of Respondents Citing This Reason | Type of Motivation |
|---|---|---|
| Quality of financial advice and services | 32% | Emotion-based reason |
| Quality of relationship | 21% | Emotion-based reason |
| Cost of services | 17% | Financial-based reason |
| Return performance | 11% | Financial-based reason |
| Comfort handling financial issues on their own | 10% | Emotion-based reason |
Numbers may not total 100 due to rounding. Respondents could select more than one answer.
Numbers may not total 100 due to rounding. Respondents could select more than one answer.
While firing an advisor is rare, many of the primary drivers behind firing decisions are also emotionally driven.
Often, advisors were fired due to the quality of the relationship. In many cases, this was due to an advisor not dedicating enough time to fully grasp their personal financial goals. Additionally, wealthier, and more financially literate clients are more likely to fire their advisors—highlighting the importance of understanding the client.
Key Takeaways
Given these driving factors, here are five ways that advisors can build a lasting relationship through recognizing their clients’ emotional needs:
- Understand your clients’ deeper goals
- Reach out proactively
- Act as a financial coach
- Keep clients updated
- Conduct goal-setting exercises on a regular basis
By communicating their value and setting expectations early, advisors can help prevent setbacks in their practice by adeptly recognizing the emotional motivators of their clients.
Markets in a Minute
The Top 5 Reasons Clients Hire a Financial Advisor
Here are the most common drivers for hiring a financial advisor, revealing that investor motivations go beyond just financial factors.

The Top 5 Reasons Clients Hire a Financial Advisor
What drives investors to hire a financial advisor?
From saving for a down payment to planning for retirement, clients turn to advisors to guide them through life’s complex financial decisions. However, many of the key reasons for hiring a financial advisor stem from emotional factors, and go beyond purely financial motivations.
We partnered with Morningstar to show the top reasons clients hire a financial advisor to provide insight on what’s driving investor behavior.
What Drives Hiring Decisions?
Here are the most common reasons for hiring an advisor, based on a survey of 312 respondents.
| Reason for Hiring | % of Respondents Citing This Reason | Type of Motivation |
|---|---|---|
| Specific goals or needs | 32% | Financial-based reason |
| Discomfort handling finances | 32% | Emotion-based reason |
| Behavioral coaching | 17% | Emotion-based reason |
| Recommended by family or friends | 12% | Emotion-based reason |
| Quality of relationship | 10% | Emotion-based reason |
Numbers may not total 100 due to rounding. Respondents could select more than one answer.
While financial factors played an important role in hiring decisions, emotional reasons made up the largest share of total responses.
This illustrates that clients place a high degree of importance on reaching specific goals or needs, and how an advisor communicates with them. Furthermore, clients seek out advisors for behavioral coaching to help them make informed decisions while staying the course.
Key Takeaways
With this in mind, here are five ways advisors can provide value to their clients and grow their practice:
- Address clients’ emotional needs early on
- Demonstrate how you can offer support
- Use ordinary language
- Provide education to help clients stay on track
- Acknowledge that these are issues we all face
By addressing emotional factors, advisors can more effectively help clients’ navigate intricate financial decisions and avoid common behavioral mistakes.

The Top 5 Reasons Clients Fire a Financial Advisor

The Top 5 Reasons Clients Hire a Financial Advisor

Visualizing the Growth of $100, by Asset Class

How Small Investments Make a Big Impact Over Time

What Were the Top Performing Investment Themes of 2023?
-

 Infographics2 years ago
The Top Investment Quotes Every Investor Should Know
-

 Markets in a Minute2 years ago
Mapped: The Growth in U.S. House Prices by State
-

 Markets in a Minute2 years ago
How Closely Related Are Historical Mortgage Rates and Housing Prices?
-

 Infographics2 years ago
A Visual Guide to Stagflation, Inflation, and Deflation
-

 Markets in a Minute1 year ago
Mapped: Global Energy Prices, by Country in 2022
-

 Infographics3 years ago
The 5 Fastest Growing Industries of the Next Decade
-

 Markets in a Minute2 years ago
Visualizing Historical Oil Prices (1968-2022)
-

 Infographics1 year ago
Visual Guide: The Three Types of Economic Indicators
