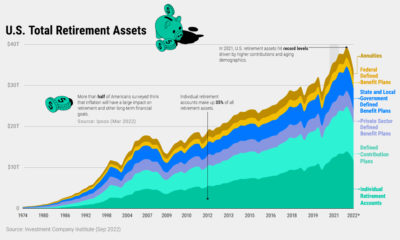

U.S. retirement assets have faced challenging conditions amid market headwinds—but over the last decade these assets have nearly doubled.


From GDP to interest rates, this infographic shows key economic indicators for navigating the massive U.S. economy.
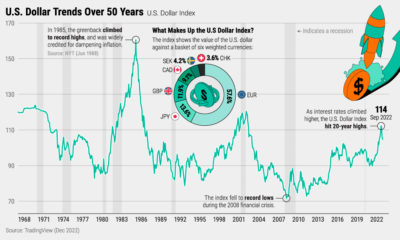

The U.S. dollar hit 20-year highs in 2022. Why is the dollar so strong, and what does it mean for financial markets and investors?
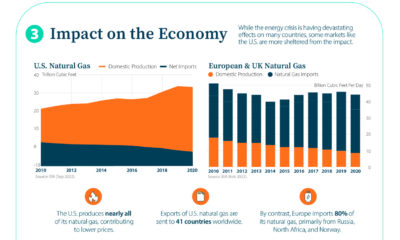

Europe's energy crisis could last well into 2023. Here's how the energy shock is causing ripple effects across the broader economy.
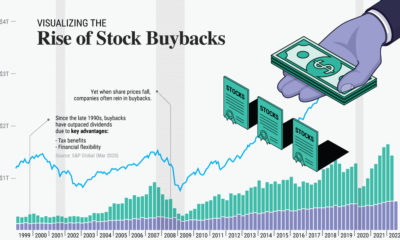

Unlike the last two downturns, stock buybacks could hit a record $1.3T in 2022. We chart their growth over the last two decades.


Energy prices have been extremely volatile in 2022. Which countries are seeing the highest prices in the world?
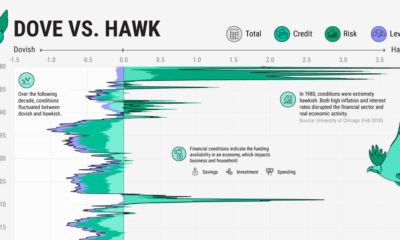

We show the Financial Conditions Index, which breaks down the state of U.S. financial markets based on 105 indicators.
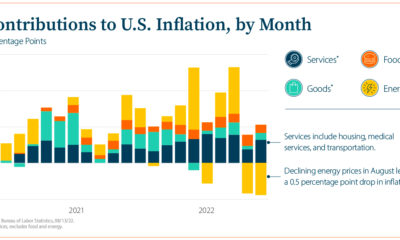

This infographic explores questions on today’s inflationary environment as the economy faces persistent price pressures.


Financial markets are facing headwinds against a changing economic backdrop. Here is the macroeconomic risk map in 2022.
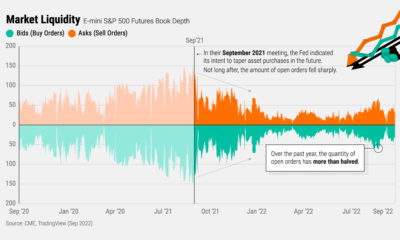

Interest rate hikes and quantitative tightening are reducing liquidity and raising volatility in markets, but why exactly does this happen?