
Markets in a Minute
Wall Street vs Main Street: The Stock Market is Not the Economy
This infographic is available as a poster.
This infographic is available as a poster.
Wall Street vs Main Street
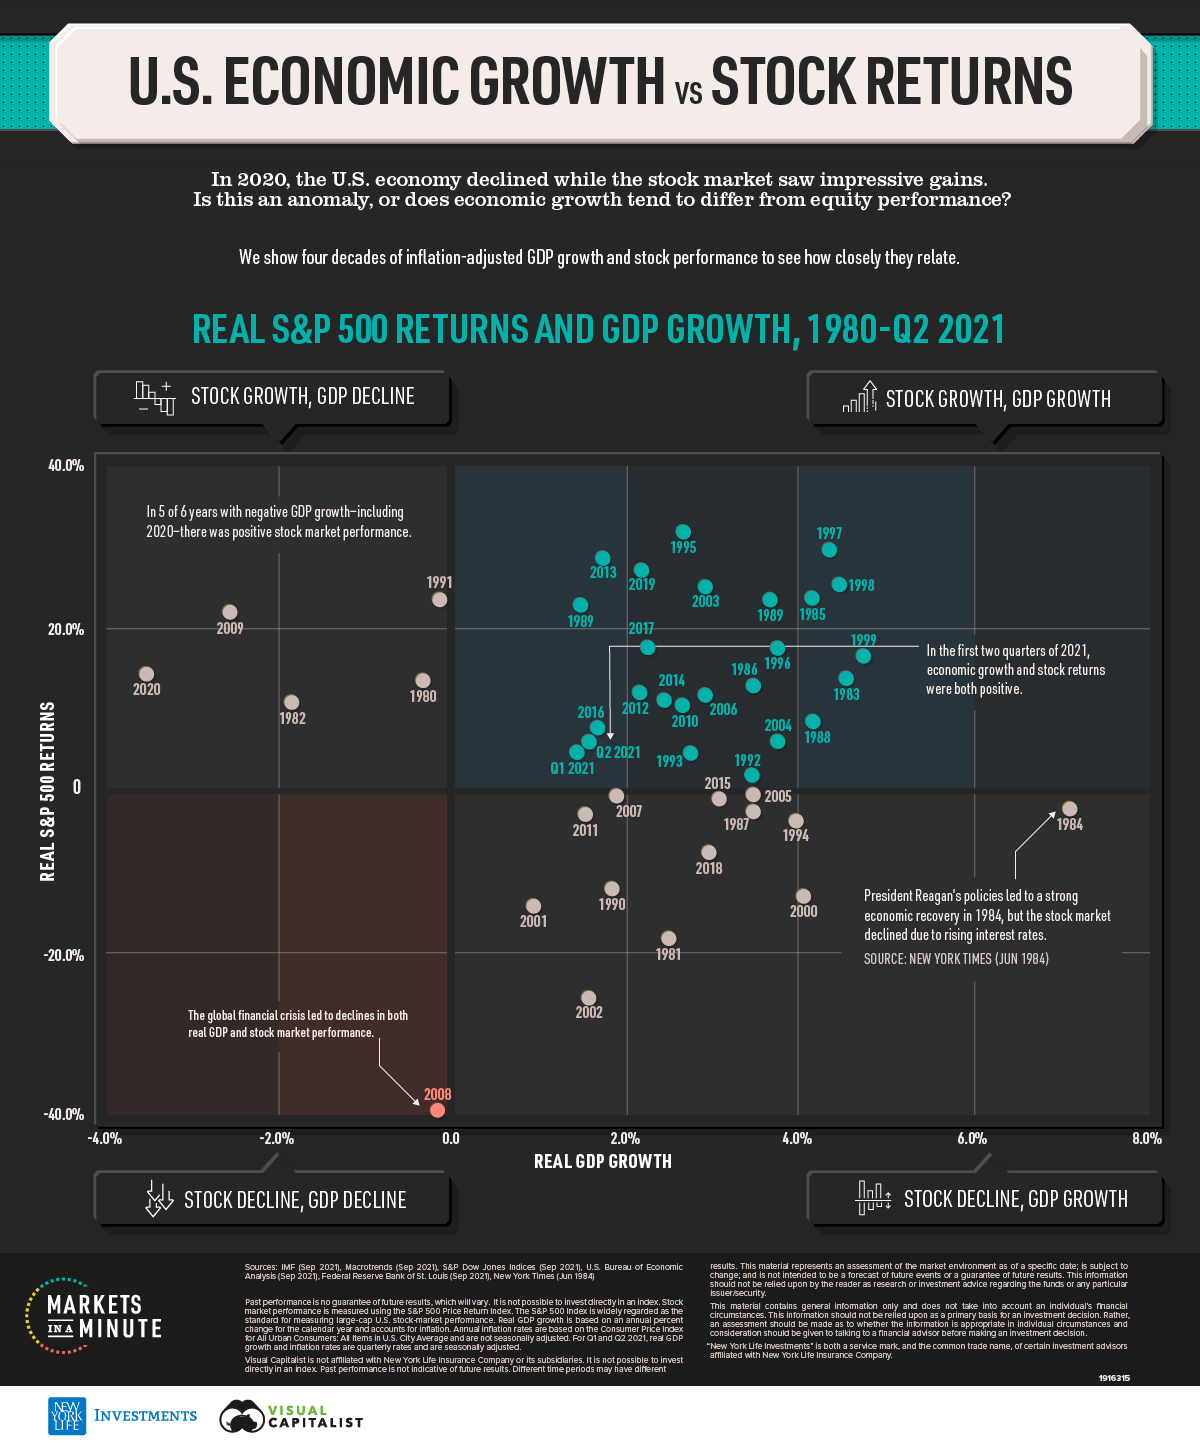
In 2020, the stock market and the economy had a very public break up. The Wall Street vs Main Street divide—the gap between America’s financial markets and the economy—was growing. By the end of the year, the S&P 500 Index closed at a record high. In contrast, 20 million Americans remained unemployed, up from 2 million at the start of the year.
Was 2020 an outlier, or does the performance of the stock market typically diverge from the economy? In this Markets in a Minute chart from New York Life Investments, we show U.S. economic growth and stock market performance over the last four decades, to see how closely the two relate.
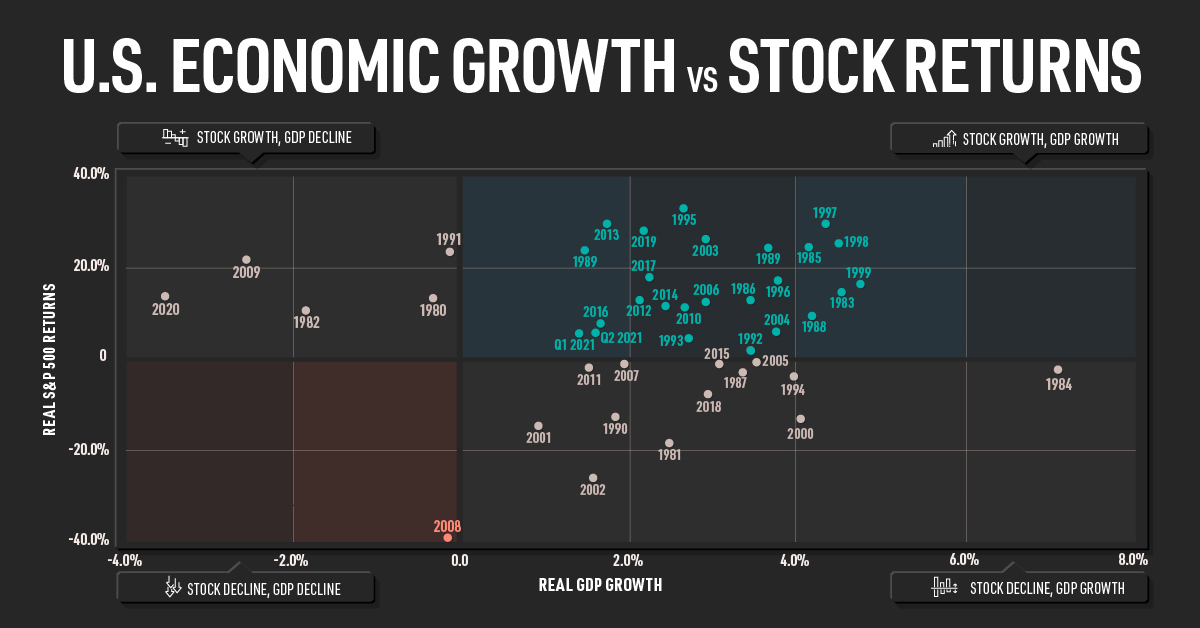
GDP Growth and S&P 500 Returns
Here’s how annual GDP growth and S&P 500 Index returns stack up from 1980 to the second quarter of 2021. Both metrics are net of inflation.
| Year | Real GDP Growth | Real S&P 500 Returns |
|---|---|---|
| 1980 | -0.3% | 13.9% |
| 1981 | 2.5% | -18.3% |
| 1982 | -1.8% | 10.8% |
| 1983 | 4.6% | 13.4% |
| 1984 | 7.2% | -2.5% |
| 1985 | 4.2% | 23.0% |
| 1986 | 3.5% | 12.9% |
| 1987 | 3.5% | -2.2% |
| 1988 | 4.2% | 7.9% |
| 1989 | 3.7% | 22.4% |
| 1990 | 1.9% | -12.4% |
| 1991 | -0.1% | 23.4% |
| 1992 | 3.5% | 1.4% |
| 1993 | 2.8% | 4.4% |
| 1994 | 4.0% | -4.2% |
| 1995 | 2.7% | 31.4% |
| 1996 | 3.8% | 17.2% |
| 1997 | 4.4% | 29.3% |
| 1998 | 4.5% | 25.1% |
| 1999 | 4.8% | 16.6% |
| 2000 | 4.1% | -13.5% |
| 2001 | 1.0% | -14.6% |
| 2002 | 1.7% | -26.0% |
| 2003 | 2.9% | 24.5% |
| 2004 | 3.8% | 5.8% |
| 2005 | 3.5% | -0.7% |
| 2006 | 2.9% | 11.4% |
| 2007 | 1.9% | -0.6% |
| 2008 | -0.1% | -39.2% |
| 2009 | -2.5% | 21.6% |
| 2010 | 2.6% | 11.1% |
| 2011 | 1.6% | -3.1% |
| 2012 | 2.2% | 11.6% |
| 2013 | 1.8% | 28.3% |
| 2014 | 2.5% | 10.9% |
| 2015 | 3.1% | -1.4% |
| 2016 | 1.7% | 7.3% |
| 2017 | 2.3% | 17.2% |
| 2018 | 3.0% | -8.1% |
| 2019 | 2.2% | 26.8% |
| 2020 | -3.5% | 14.9% |
| Q1 2021 | 1.5% | 4.5% |
| Q2 2021 | 1.6% | 5.8% |
Note: For Q1 and Q2 2021, real GDP growth and inflation rates are quarterly rates and are seasonally adjusted.
More often than not, GDP growth and S&P 500 Index returns have both been positive. The late ‘90s saw particularly strong economic activity and stock performance. According to the White House, economic growth was bolstered by cutting the deficit, modernizing job training, and increasing exports. Meanwhile, increasing investor confidence and the growing tech bubble led to annual stock market returns that exceeded 20%.
In the selected timeframe, only 2008 saw a decline in both the stock market and the economy. This was, of course, caused by the Global Financial Crisis. Banks lent out subprime mortgages, or mortgages to people with impaired credit ratings. These mortgages were then pooled together and repackaged into investments such as mortgage-backed securities (MBS). When interest rates rose and home prices collapsed, this led to mortgage defaults and financial institution bankruptcies as many MBS investments became worthless.
Moving in Opposite Directions
What about when the Wall Street vs Main Street divide grows?
Historically, it has been more common to see positive GDP growth and negative stock performance. For example, real GDP grew by a whopping 7% in 1984 due to “Reaganomics”, such as tax cuts and anti-inflation monetary policy. However, the stock market declined as rising treasury yields of up to 14% made fixed income investments more attractive than equities.
On the other hand, in five of the six years with negative GDP growth, there have been positive stock returns. The most recent example of this is 2020. Real GDP declined by 3.5%, while the S&P 500 returned almost 15% net of inflation.
The Stock Market is not the Economy
There are a number of reasons why the stock market may not necessarily reflect what is happening in the economy.
- The stock market reflects long-term views. A stock’s price factors in what investors think a company will earn in the future. If investors are confident in the likelihood of an economic recovery, stock prices will likely rise. In contrast, GDP growth is a hard measure of current activity.
- Sector weightings in the stock market do not reflect their contributions to GDP. The stock market remained resilient in 2020 largely because technology, media, and telecom (TMT) stocks performed well. Despite making up 35% of the market cap of the largest 1,000 U.S. stocks, these companies only account for 8% of U.S. GDP. In contrast, hard-hit companies such as restaurants and gyms generate lots of jobs and contribute materially to GDP. However, many of these businesses accounted for a small portion of the stock market or are not even publicly listed.
- Fiscal policy lags behind monetary policy. The U.S. Federal Reserve (Fed) can act quickly. For instance, the Fed bought $1.7 trillion of Treasury securities between mid-March and June 2020 to stabilize financial markets. On the other hand, fiscal support requires legislative approvals. The U.S. government initially provided large-scale economic stimulus through the CARES Act in March 2020, but further relief packages were stalled due to political disagreements.
While many factors are at play, the above can help explain the Wall Street vs Main Street divide.
Wall Street vs Main Street: Together and Apart
Over the last 41 years, the economy and the stock market have moved in opposite directions almost as often as they have moved in the same direction. Here’s a summary of their movements from 1980-2020.
| # of Years | |
|---|---|
| Stock Growth, GDP Growth | 22 |
| Stock Decline, GDP Growth | 13 |
| Stock Growth, GDP Decline | 5 |
| Stock Decline, GDP Decline | 1 |
Since 1980, these time periods of differing performance have never lasted more than three consecutive years. In fact, one economist described the stock market and the unemployment rate as two people walking down the street, tethered by a rope.
”When the rope is slack, they move apart. But they can never get too far away from each other.”
—Roger Farmer, University of Warwick economist
After their public breakup in 2020, the Wall Street vs Main Street divide appears to have healed. In the first two quarters of 2021, both the stock market and the economy saw growth. Perhaps it’s easiest to sum up their relationship in two words: it’s complicated.


Markets in a Minute
The Top 5 Reasons Clients Fire a Financial Advisor
Firing an advisor is often driven by more than cost and performance factors. Here are the top reasons clients ‘break up’ with their advisors.

The Top 5 Reasons Clients Fire a Financial Advisor
What drives investors to fire a financial advisor?
From saving for a down payment to planning for retirement, clients turn to advisors to guide them through life’s complex financial decisions. However, many of the key reasons for firing a financial advisor stem from emotional factors, and go beyond purely financial motivations.
We partnered with Morningstar to show the top reasons clients fire an advisor to provide insight on what’s driving investor behavior.
What Drives Firing Decisions?
Here are the top reasons clients terminated their advisor, based on a survey of 184 respondents:
| Reason for Firing | % of Respondents Citing This Reason | Type of Motivation |
|---|---|---|
| Quality of financial advice and services | 32% | Emotion-based reason |
| Quality of relationship | 21% | Emotion-based reason |
| Cost of services | 17% | Financial-based reason |
| Return performance | 11% | Financial-based reason |
| Comfort handling financial issues on their own | 10% | Emotion-based reason |
Numbers may not total 100 due to rounding. Respondents could select more than one answer.
Numbers may not total 100 due to rounding. Respondents could select more than one answer.
While firing an advisor is rare, many of the primary drivers behind firing decisions are also emotionally driven.
Often, advisors were fired due to the quality of the relationship. In many cases, this was due to an advisor not dedicating enough time to fully grasp their personal financial goals. Additionally, wealthier, and more financially literate clients are more likely to fire their advisors—highlighting the importance of understanding the client.
Key Takeaways
Given these driving factors, here are five ways that advisors can build a lasting relationship through recognizing their clients’ emotional needs:
- Understand your clients’ deeper goals
- Reach out proactively
- Act as a financial coach
- Keep clients updated
- Conduct goal-setting exercises on a regular basis
By communicating their value and setting expectations early, advisors can help prevent setbacks in their practice by adeptly recognizing the emotional motivators of their clients.
Markets in a Minute
The Top 5 Reasons Clients Hire a Financial Advisor
Here are the most common drivers for hiring a financial advisor, revealing that investor motivations go beyond just financial factors.

The Top 5 Reasons Clients Hire a Financial Advisor
What drives investors to hire a financial advisor?
From saving for a down payment to planning for retirement, clients turn to advisors to guide them through life’s complex financial decisions. However, many of the key reasons for hiring a financial advisor stem from emotional factors, and go beyond purely financial motivations.
We partnered with Morningstar to show the top reasons clients hire a financial advisor to provide insight on what’s driving investor behavior.
What Drives Hiring Decisions?
Here are the most common reasons for hiring an advisor, based on a survey of 312 respondents.
| Reason for Hiring | % of Respondents Citing This Reason | Type of Motivation |
|---|---|---|
| Specific goals or needs | 32% | Financial-based reason |
| Discomfort handling finances | 32% | Emotion-based reason |
| Behavioral coaching | 17% | Emotion-based reason |
| Recommended by family or friends | 12% | Emotion-based reason |
| Quality of relationship | 10% | Emotion-based reason |
Numbers may not total 100 due to rounding. Respondents could select more than one answer.
While financial factors played an important role in hiring decisions, emotional reasons made up the largest share of total responses.
This illustrates that clients place a high degree of importance on reaching specific goals or needs, and how an advisor communicates with them. Furthermore, clients seek out advisors for behavioral coaching to help them make informed decisions while staying the course.
Key Takeaways
With this in mind, here are five ways advisors can provide value to their clients and grow their practice:
- Address clients’ emotional needs early on
- Demonstrate how you can offer support
- Use ordinary language
- Provide education to help clients stay on track
- Acknowledge that these are issues we all face
By addressing emotional factors, advisors can more effectively help clients’ navigate intricate financial decisions and avoid common behavioral mistakes.

The Top 5 Reasons Clients Fire a Financial Advisor

The Top 5 Reasons Clients Hire a Financial Advisor

Visualizing the Growth of $100, by Asset Class

How Small Investments Make a Big Impact Over Time

What Were the Top Performing Investment Themes of 2023?
-

 Infographics2 years ago
The Top Investment Quotes Every Investor Should Know
-

 Markets in a Minute2 years ago
Mapped: The Growth in U.S. House Prices by State
-

 Markets in a Minute2 years ago
How Closely Related Are Historical Mortgage Rates and Housing Prices?
-

 Infographics2 years ago
A Visual Guide to Stagflation, Inflation, and Deflation
-

 Markets in a Minute1 year ago
Mapped: Global Energy Prices, by Country in 2022
-

 Infographics3 years ago
The 5 Fastest Growing Industries of the Next Decade
-

 Markets in a Minute2 years ago
Visualizing Historical Oil Prices (1968-2022)
-

 Infographics1 year ago
Visual Guide: The Three Types of Economic Indicators
