
Markets in a Minute
Visualizing the Real Estate Investment Universe
This infographic is available as a poster.
This infographic is available as a poster.
Visualizing the Real Estate Investment Universe
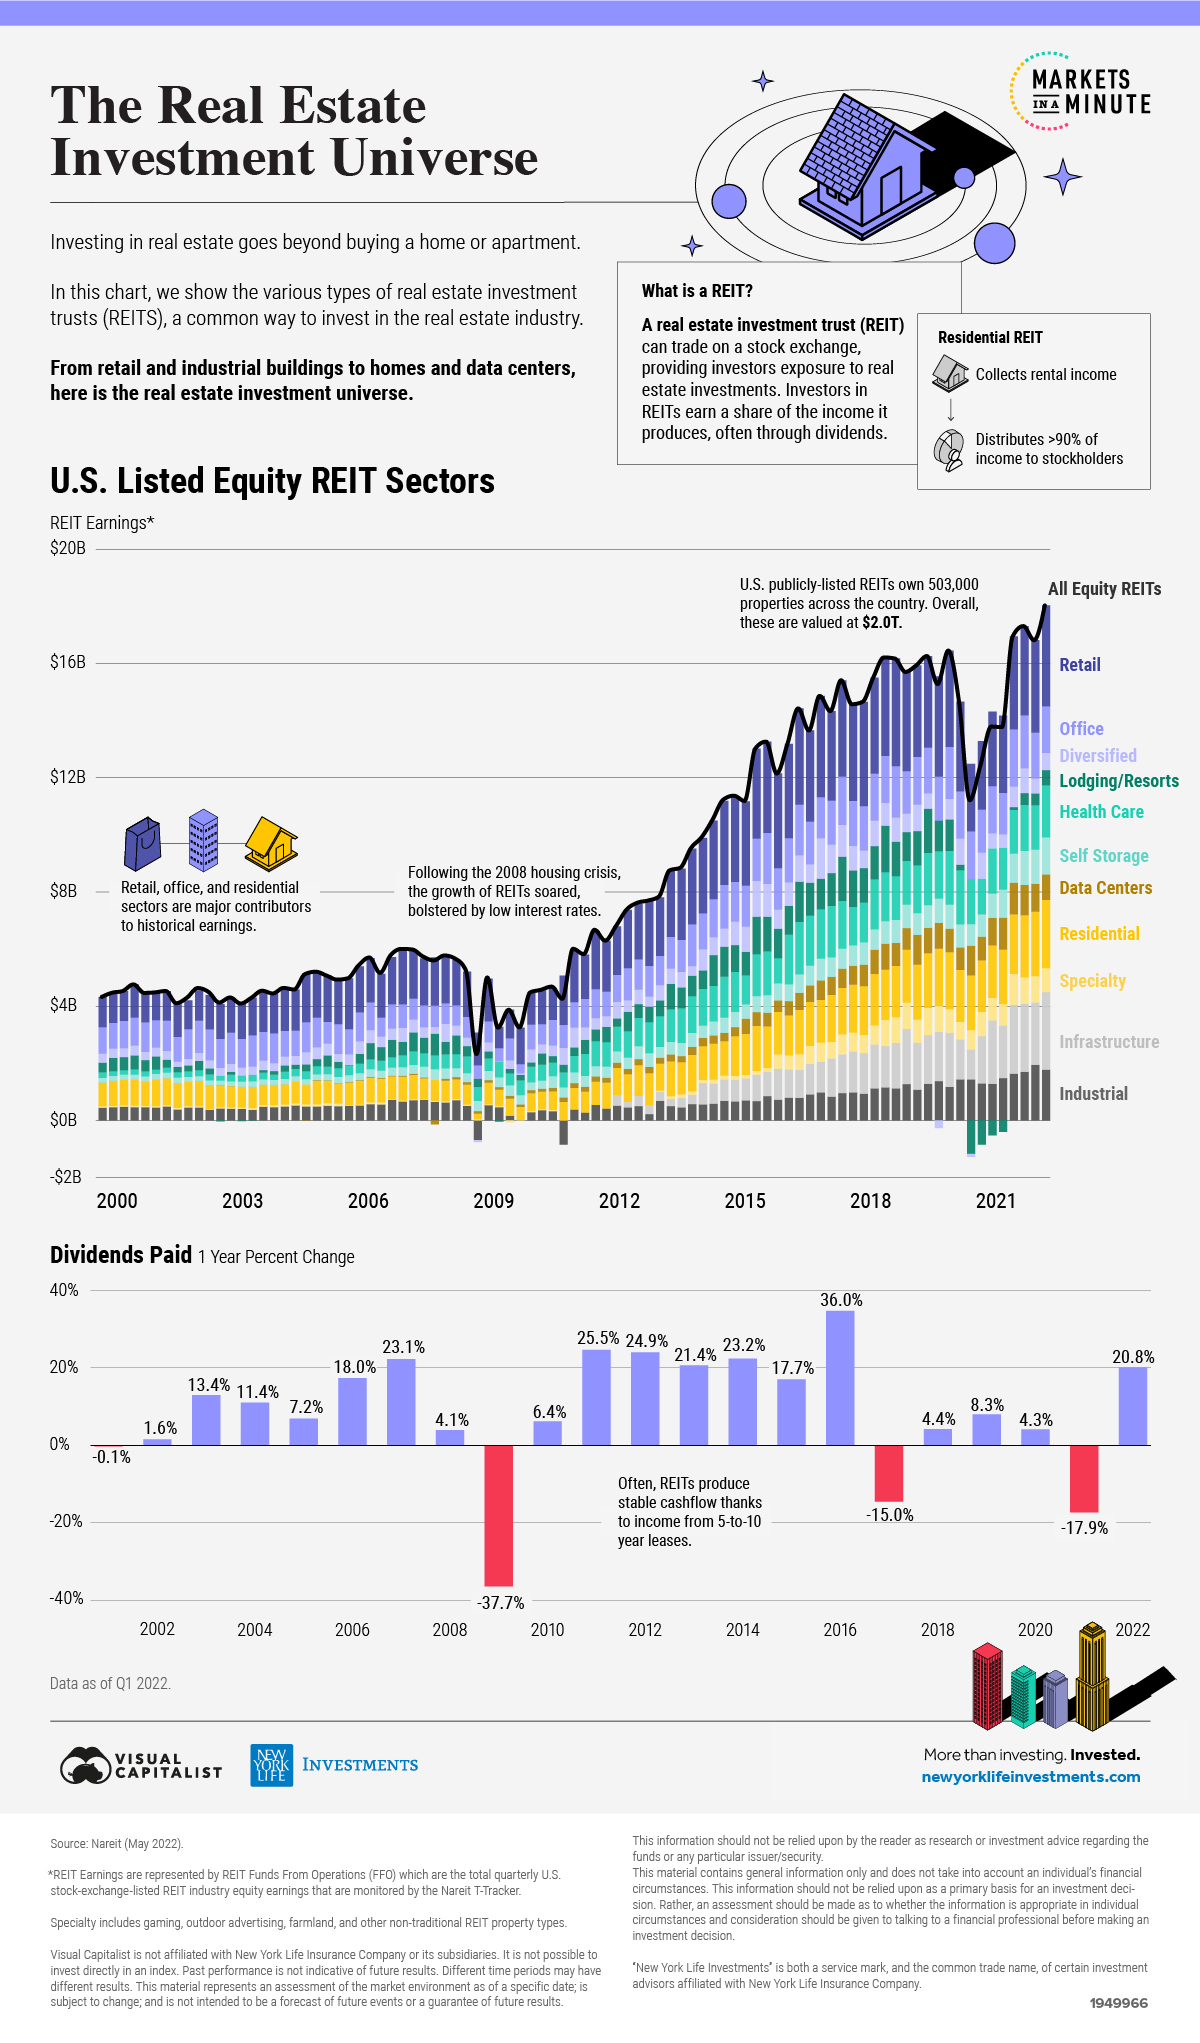
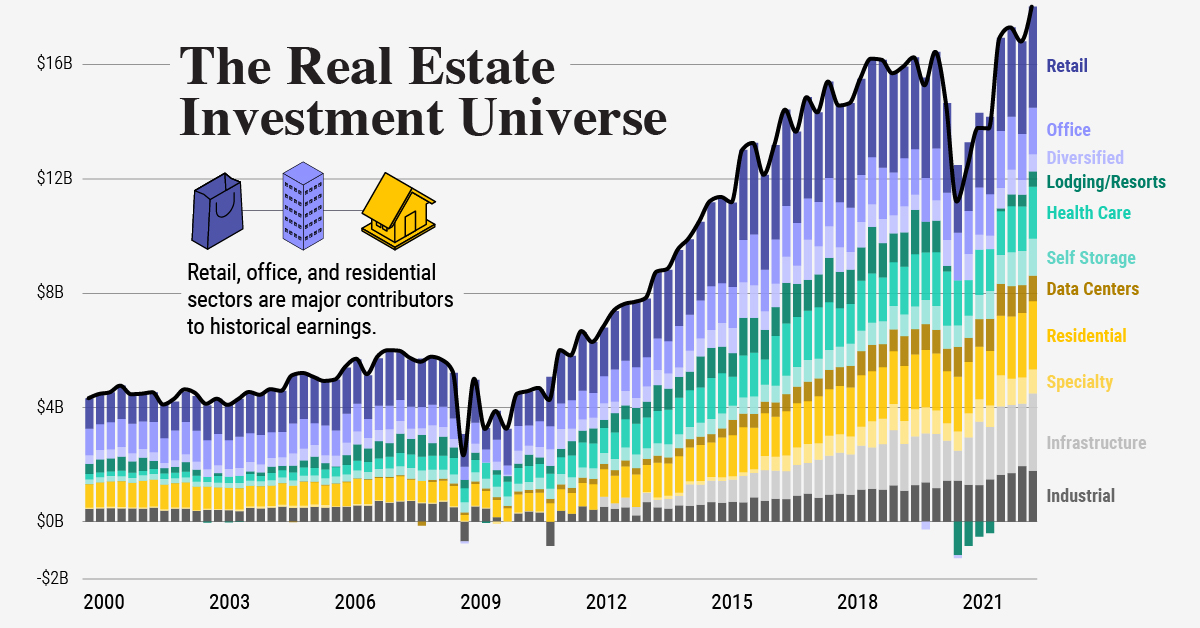
From residential property to data centers, real estate investment covers many different sectors.
While office, retail, and residential properties may come to mind first, the investment landscape extends to property types like health care and infrastructure—two sectors that were booming in 2021 as demand for laboratory space increased and facilities underpinning the digital economy expanded.
In this Markets in a Minute from New York Life Investments, we show the scope of U.S. publicly listed real estate investment trusts (REITs) by sector.
How Do REITs Work?
Most often, REITs are publicly-listed investments on a stock exchange. These investment vehicles manage income-producing properties and provide investors exposure to the real estate industry both through the price appreciation of property assets and the income earned through mortgages or leases.
By law, roughly 90% of this taxable income must be distributed to stockholders in dividends.
For instance, an office REIT may own a number of skyscrapers and office buildings that collect leases from tenants. This income from tenants—such as Salesforce or Amazon—would then be distributed to shareholders of the office REIT.
Today, U.S. publicly-listed REITs own 503,000 properties across the country valued at $2.0 trillion.
What are the Different Types of Real Estate Investment?
U.S. listed REITs fall into roughly 17 categories, according to data from Nareit.
Below, we will show each sector based on their earnings in the first quarter of 2022 as measured by funds from operations (FFO). FFO looks at cash flow earned from operations and is considered a broad performance indicator for the industry.
| Sector | Earnings* |
|---|---|
| Retail | $3.5B |
| Infrastructure | $2.7B |
| Residential | $2.4B |
| Industrial | $1.8B |
| Health Care | $1.8B |
| Apartments | $1.7B |
| Office | $1.6B |
| Self Storage | $1.3B |
| Shopping Centers | $1.2B |
| Free Standing | $1.2B |
| Regional Malls | $1.1B |
| Data Centers | $0.9B |
| Specialty** | $0.8B |
| Diversified | $0.6B |
| Lodging/Resorts | $0.5B |
| Single Family Homes | $0.4B |
| Manufactured Homes | $0.3B |
| All Equity REITs | $18.0B |
*Measured by Funds From Operations (FFO).
**Specialty includes gaming, outdoor advertising, farmland, and other non-traditional REIT property types. Data as of Q1 2022.
Despite thousands of storefronts being shut down during COVID-19, retail earnings remained the largest across all sectors, at $3.5 billion. In fact, earnings bounced back to pre-pandemic levels during the first quarter of 2022.
As the second largest sector, infrastructure saw $2.7 billion in earnings, rising over 47% compared to the first quarter of 2021. Infrastructure includes wireless infrastructure, fiber cables, and energy pipelines.
Residential, at $2.4 billion, is the third largest sector. Like retail, earnings have exceeded pre-pandemic levels, rising over 19% since the end of 2019.
Overall, real estate investment earnings hit a record $18 billion, driven by sectors hit hardest by the pandemic.
Key Characteristics of Real Estate Investments
Thanks to long-term leases—often between 5 and 10 years—REITs provide stable dividend earnings to investors. In 2021, the average dividend yield of U.S. REITs was 2.6%, more than double the yield of the S&P 500 at 1.2%.
In addition, they are often well-positioned during inflationary environments. As the below table shows, during periods of high inflation REITs average annualized returns were 16%. Even better, REIT earnings increased as inflation levels continued to rise.
| Inflation Environment | U.S. REIT Price Return | U.S. REIT Income Return | Total Annualized Return |
|---|---|---|---|
| High Inflation (>6.3%) | 5.3% | 10.7% | 16.0% |
| Moderate Inflation (2.0%-6.3%) | 6.2% | 6.9% | 13.1% |
| Low Inflation(<2.0%) | 4.9% | 5.1% | 10.0% |
Source: Morningstar (Jun 2021). REIT returns represented by the FTSE Nareit Equity REITs Index from Jan 30, 1976 to Jun 30, 2021.
While REITs are often positively correlated with inflation, they often have a low correlation with equities. For this reason, they can serve as a key diversifier when markets take a turn for the worse, potentially reducing the risk profile of your portfolio.
Due to the combination of these factors, real estate investments have proven resilient, with many REITS paying higher dividends than other forms of investments.


Markets in a Minute
The Top 5 Reasons Clients Fire a Financial Advisor
Firing an advisor is often driven by more than cost and performance factors. Here are the top reasons clients ‘break up’ with their advisors.

The Top 5 Reasons Clients Fire a Financial Advisor
What drives investors to fire a financial advisor?
From saving for a down payment to planning for retirement, clients turn to advisors to guide them through life’s complex financial decisions. However, many of the key reasons for firing a financial advisor stem from emotional factors, and go beyond purely financial motivations.
We partnered with Morningstar to show the top reasons clients fire an advisor to provide insight on what’s driving investor behavior.
What Drives Firing Decisions?
Here are the top reasons clients terminated their advisor, based on a survey of 184 respondents:
| Reason for Firing | % of Respondents Citing This Reason | Type of Motivation |
|---|---|---|
| Quality of financial advice and services | 32% | Emotion-based reason |
| Quality of relationship | 21% | Emotion-based reason |
| Cost of services | 17% | Financial-based reason |
| Return performance | 11% | Financial-based reason |
| Comfort handling financial issues on their own | 10% | Emotion-based reason |
Numbers may not total 100 due to rounding. Respondents could select more than one answer.
Numbers may not total 100 due to rounding. Respondents could select more than one answer.
While firing an advisor is rare, many of the primary drivers behind firing decisions are also emotionally driven.
Often, advisors were fired due to the quality of the relationship. In many cases, this was due to an advisor not dedicating enough time to fully grasp their personal financial goals. Additionally, wealthier, and more financially literate clients are more likely to fire their advisors—highlighting the importance of understanding the client.
Key Takeaways
Given these driving factors, here are five ways that advisors can build a lasting relationship through recognizing their clients’ emotional needs:
- Understand your clients’ deeper goals
- Reach out proactively
- Act as a financial coach
- Keep clients updated
- Conduct goal-setting exercises on a regular basis
By communicating their value and setting expectations early, advisors can help prevent setbacks in their practice by adeptly recognizing the emotional motivators of their clients.
Markets in a Minute
The Top 5 Reasons Clients Hire a Financial Advisor
Here are the most common drivers for hiring a financial advisor, revealing that investor motivations go beyond just financial factors.

The Top 5 Reasons Clients Hire a Financial Advisor
What drives investors to hire a financial advisor?
From saving for a down payment to planning for retirement, clients turn to advisors to guide them through life’s complex financial decisions. However, many of the key reasons for hiring a financial advisor stem from emotional factors, and go beyond purely financial motivations.
We partnered with Morningstar to show the top reasons clients hire a financial advisor to provide insight on what’s driving investor behavior.
What Drives Hiring Decisions?
Here are the most common reasons for hiring an advisor, based on a survey of 312 respondents.
| Reason for Hiring | % of Respondents Citing This Reason | Type of Motivation |
|---|---|---|
| Specific goals or needs | 32% | Financial-based reason |
| Discomfort handling finances | 32% | Emotion-based reason |
| Behavioral coaching | 17% | Emotion-based reason |
| Recommended by family or friends | 12% | Emotion-based reason |
| Quality of relationship | 10% | Emotion-based reason |
Numbers may not total 100 due to rounding. Respondents could select more than one answer.
While financial factors played an important role in hiring decisions, emotional reasons made up the largest share of total responses.
This illustrates that clients place a high degree of importance on reaching specific goals or needs, and how an advisor communicates with them. Furthermore, clients seek out advisors for behavioral coaching to help them make informed decisions while staying the course.
Key Takeaways
With this in mind, here are five ways advisors can provide value to their clients and grow their practice:
- Address clients’ emotional needs early on
- Demonstrate how you can offer support
- Use ordinary language
- Provide education to help clients stay on track
- Acknowledge that these are issues we all face
By addressing emotional factors, advisors can more effectively help clients’ navigate intricate financial decisions and avoid common behavioral mistakes.

The Top 5 Reasons Clients Fire a Financial Advisor

The Top 5 Reasons Clients Hire a Financial Advisor

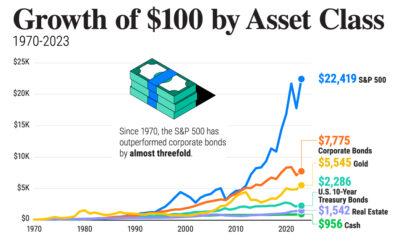
Visualizing the Growth of $100, by Asset Class

How Small Investments Make a Big Impact Over Time

What Were the Top Performing Investment Themes of 2023?
-

 Infographics2 years ago
The Top Investment Quotes Every Investor Should Know
-

 Markets in a Minute2 years ago
Mapped: The Growth in U.S. House Prices by State
-

 Markets in a Minute2 years ago
How Closely Related Are Historical Mortgage Rates and Housing Prices?
-

 Infographics2 years ago
A Visual Guide to Stagflation, Inflation, and Deflation
-

 Markets in a Minute1 year ago
Mapped: Global Energy Prices, by Country in 2022
-

 Infographics3 years ago
The 5 Fastest Growing Industries of the Next Decade
-

 Markets in a Minute2 years ago
Visualizing Historical Oil Prices (1968-2022)
-

 Infographics1 year ago
Visual Guide: The Three Types of Economic Indicators
