
Markets in a Minute
Visualizing the 200-Year History of U.S. Interest Rates
This Markets in a Minute Chart is available as a poster.
This Markets in a Minute Chart is available as a poster.
Visualizing the 200 Year History of U.S. Interest Rates
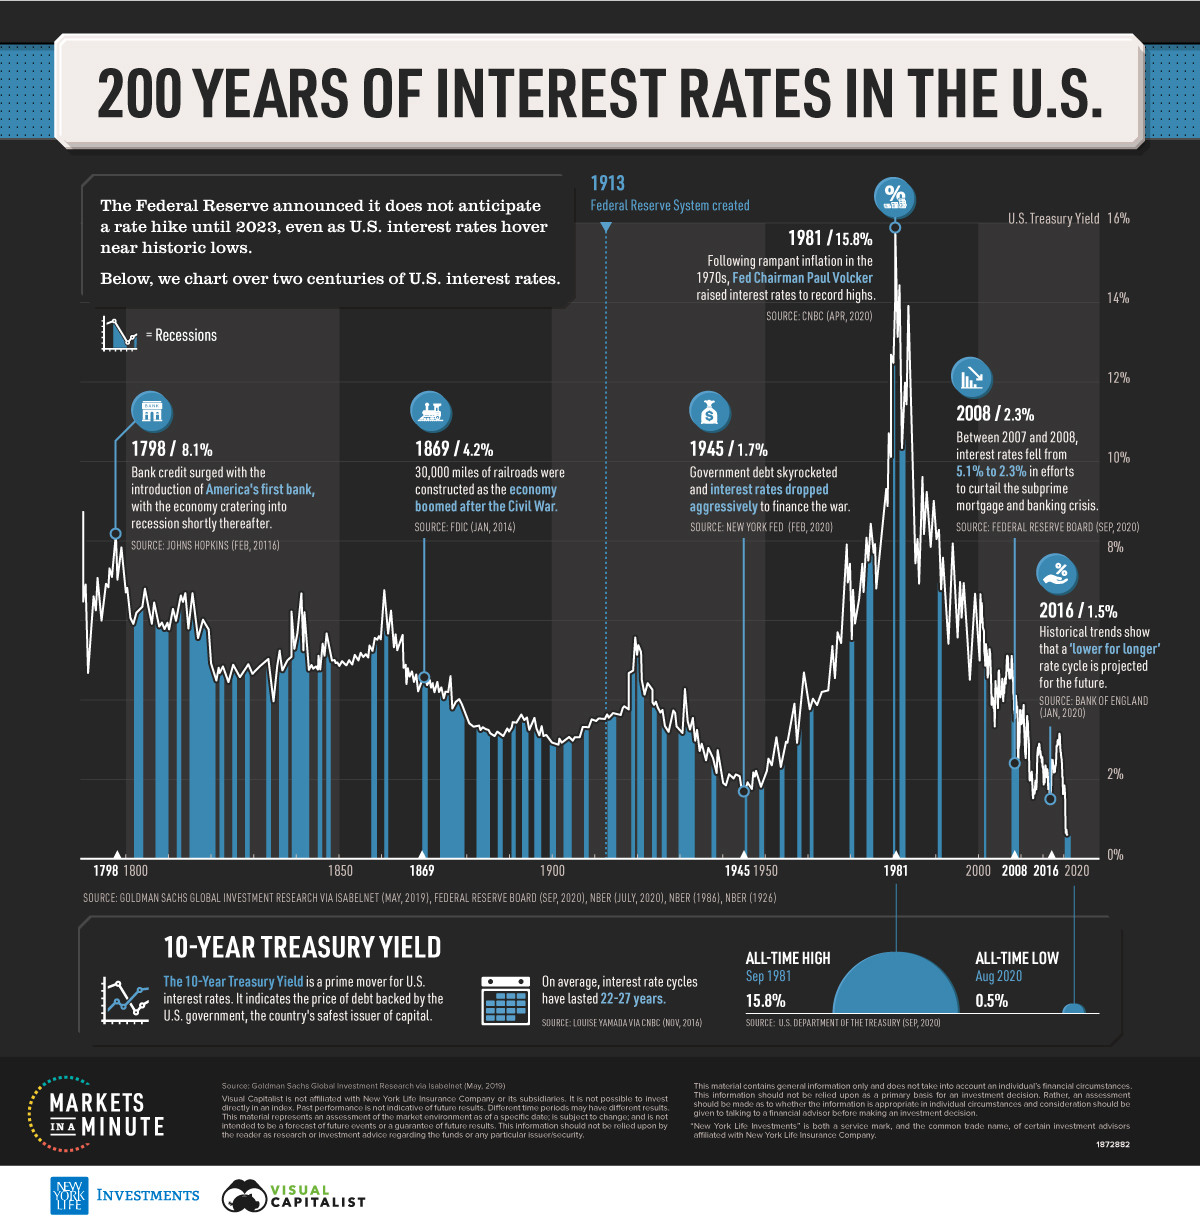
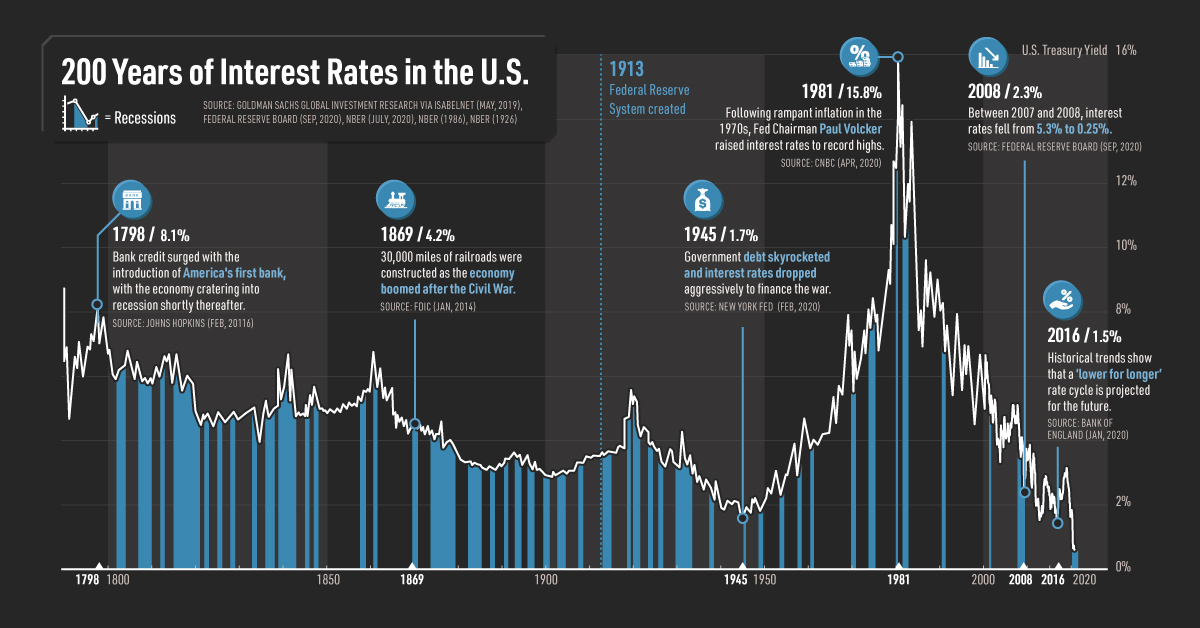
U.S. interest rates will stay near zero for at least three years as the Federal Reserve enacts measures to prop up the economy.
But are low interest rates a new phenomenon? Interestingly, one study by the Bank of England shows that this pattern of declining interest rates has taken place globally since the late Middle Ages. In fact, it suggests that these downward-sloping rate trends have taken place even before modern central banks entered the scene—illustrating an entrenched, historical trend.
This Markets in a Minute chart from New York Life Investments tracks the history of U.S. interest rates over two centuries, from the creation of the first U.S. Bank to the current historic lows.
U.S. Interest Rates: Historic Highs and Lows
What are the highest and lowest rates throughout history?
Prior to today’s historically low levels, interest rates fell to 1.7% during World War II as the U.S. government injected billions into the economy to help finance the war. Around the same time, government debt ballooned to over 100% of GDP.
Fast-forward to 1981, when interest rates hit all-time highs of 15.8%. Rampant inflation was the key economic issue in the 1970s and early 1980s, and Federal Reserve Chairman Paul Volcker instigated rate controls to restrain demand. It was a period of low economic growth and rising unemployment, with jobless figures as high as 8%.
| Year | Average Interest Rate* | Year Open | Year Close | Annual % Change |
|---|---|---|---|---|
| 2020 | 0.9% | 1.9% | 0.7%** | -65.1% |
| 2019 | 2.1% | 2.7% | 1.9% | -28.6% |
| 2018 | 2.9% | 2.5% | 2.7% | 11.8% |
| 2017 | 2.3% | 2.4% | 2.4% | -1.6% |
| 2016 | 1.8% | 2.2% | 2.4% | 7.7% |
| 2015 | 2.1% | 2.1% | 2.3% | 4.6% |
| 2014 | 2.5% | 3.0% | 2.2% | -28.6% |
| 2013 | 2.4% | 1.9% | 3.0% | 70.8% |
| 2012 | 1.8% | 2.0% | 1.8% | -5.8% |
| 2011 | 2.8% | 3.4% | 1.9% | -42.7% |
| 2010 | 3.2% | 3.9% | 3.3% | -14.3% |
| 2009 | 3.3% | 2.5% | 3.9% | 71.1% |
| 2008 | 3.7% | 3.9% | 2.3% | -44.3% |
| 2007 | 4.6% | 4.7% | 4.0% | -14.2% |
| 2006 | 4.8% | 4.4% | 4.7% | 7.3% |
| 2005 | 4.3% | 4.2% | 4.4% | 3.5% |
| 2004 | 4.3% | 4.4% | 4.2% | -0.7% |
| 2003 | 4.0% | 4.1% | 4.3% | 11.5% |
| 2002 | 4.6% | 5.2% | 3.8% | -24.5% |
| 2001 | 5.0% | 4.9% | 5.1% | -1.0% |
| 2000 | 6.0% | 6.6% | 5.1% | -20.6% |
| 1999 | 5.7% | 4.7% | 6.5% | 38.7% |
| 1998 | 5.3% | 5.7% | 4.7% | -19.1% |
| 1997 | 6.4% | 6.5% | 5.8% | -10.6% |
| 1996 | 6.4% | 5.6% | 6.4% | 15.2% |
| 1995 | 6.6% | 7.9% | 5.6% | -28.8% |
| 1994 | 7.1% | 5.9% | 7.8% | 34.5% |
| 1993 | 5.9% | 6.6% | 5.8% | -13.0% |
| 1992 | 7.0% | 6.8% | 6.7% | -0.2% |
| 1991 | 7.9% | 8.0% | 6.7% | -17.0% |
| 1990 | 8.6% | 7.9% | 8.1% | 1.9% |
| 1989 | 8.5% | 9.2% | 7.9% | -13.2% |
| 1988 | 8.9% | 8.8% | 9.1% | 3.5% |
| 1987 | 8.4% | 7.2% | 8.8% | 22.1% |
| 1986 | 7.7% | 9.0% | 7.2% | -19.7% |
| 1985 | 10.6% | 11.7% | 9.0% | -22.1% |
| 1984 | 12.5% | 11.9% | 11.6% | -2.3% |
| 1983 | 11.1% | 10.3% | 11.8% | 14.1% |
| 1982 | 13.0% | 14.2% | 10.4% | -25.9% |
| 1981 | 13.9% | 12.4% | 14.0% | 12.5% |
| 1980 | 11.4% | 10.5% | 12.4% | 20.3% |
| 1979 | 9.4% | 9.2% | 10.3% | 12.9% |
| 1978 | 8.4% | 7.8% | 9.2% | 17.6% |
| 1977 | 7.4% | 6.8% | 7.8% | 14.2% |
| 1976 | 7.6% | 7.8% | 6.8% | -12.2% |
| 1975 | 8.0% | 7.4% | 7.8% | 4.9% |
| 1974 | 7.6% | 6.9% | 7.4% | 7.3% |
| 1973 | 6.9% | 6.4% | 6.9% | 7.6% |
| 1972 | 6.2% | 5.9% | 6.4% | 8.8% |
| 1971 | 6.2% | 6.5% | 5.9% | -9.4% |
| 1970 | 7.4% | 7.9% | 6.5% | -17.5% |
| 1969 | 6.7% | 6.0% | 7.9% | 27.9% |
| 1968 | 5.6% | 5.6% | 6.2% | 8.1% |
| 1967 | 5.1% | 4.7% | 5.7% | 22.8% |
| 1966 | 4.9% | 4.6% | 4.6% | -0.2% |
| 1965 | 4.3% | 4.2% | 4.7% | 10.5% |
| 1964 | 4.2% | 4.1% | 4.2% | 1.7% |
| 1963 | 4.0% | 3.8% | 4.1% | 7.5% |
*Indicated by 10-Year Treasury Yields, a prime mover of interest rates
**As of September 28, 2020
Source: Macrotrends
Over the last year, interest rates have dropped from 2.1% to 0.9%, a 65% decrease. Rates are now below 1945 levels—and well under 6.1%, the average U.S. interest rate over the last 58 years.
Longer Horizons
Interest rates in the 18th and 19th centuries also provide illuminating trends.
After falling for three decades at the turn of the century, interest rates stood at 4% in 1835. That year, president Andrew Jackson paid off the U.S. national debt for the first and only time in history, as debt was seen as a “moral failing” or “black magic” in his eyes.
One consequence of this was the government sold swaths of land to finance the federal budget, ultimately avoiding the accumulation of debt. It didn’t last for long. The influx of land sales led to a real estate bubble and eventually, the economy fell into a recession. The government had to borrow again and rates ticked higher over the next several years.
Similarly, after the Civil War ended in 1865, data shows that interest rates also witnessed a long-term, negative slope, which ended in 1945. It then took 100 years for interest rates to exceed the highs of the Civil War era.
Why So Low For So Long?
While the exact reasons are unclear, broad structural forces may be influencing interest rates.
One explanation suggests that higher capital accumulation could be a factor. Another suggests that modern welfare states, with their increased public spending, have as well. For instance, average expenditures of total GDP in the UK averaged 35% between 1981 and 1960, compared to 8% between 1700 and 1750.
Along with this, rates usually have cycles that last between 22 and 27 years. When cycles shift from rising to falling rates, a quick reversal typically takes place. This was seen in 1982, when interest rates dropped 25%—from 14.2% to 10.4%—in one year. However, a different trend can be seen when falling rates switch to rising trends. These reversals typically average 2-14 years.
As near-zero rates seem more likely for the extended future, market distortions—such as ultra-low income yields—may become more commonplace. In turn, investors may want to rethink traditional asset allocations between fixed income, equities, and alternatives.


Markets in a Minute
The Top 5 Reasons Clients Fire a Financial Advisor
Firing an advisor is often driven by more than cost and performance factors. Here are the top reasons clients ‘break up’ with their advisors.

The Top 5 Reasons Clients Fire a Financial Advisor
What drives investors to fire a financial advisor?
From saving for a down payment to planning for retirement, clients turn to advisors to guide them through life’s complex financial decisions. However, many of the key reasons for firing a financial advisor stem from emotional factors, and go beyond purely financial motivations.
We partnered with Morningstar to show the top reasons clients fire an advisor to provide insight on what’s driving investor behavior.
What Drives Firing Decisions?
Here are the top reasons clients terminated their advisor, based on a survey of 184 respondents:
| Reason for Firing | % of Respondents Citing This Reason | Type of Motivation |
|---|---|---|
| Quality of financial advice and services | 32% | Emotion-based reason |
| Quality of relationship | 21% | Emotion-based reason |
| Cost of services | 17% | Financial-based reason |
| Return performance | 11% | Financial-based reason |
| Comfort handling financial issues on their own | 10% | Emotion-based reason |
Numbers may not total 100 due to rounding. Respondents could select more than one answer.
Numbers may not total 100 due to rounding. Respondents could select more than one answer.
While firing an advisor is rare, many of the primary drivers behind firing decisions are also emotionally driven.
Often, advisors were fired due to the quality of the relationship. In many cases, this was due to an advisor not dedicating enough time to fully grasp their personal financial goals. Additionally, wealthier, and more financially literate clients are more likely to fire their advisors—highlighting the importance of understanding the client.
Key Takeaways
Given these driving factors, here are five ways that advisors can build a lasting relationship through recognizing their clients’ emotional needs:
- Understand your clients’ deeper goals
- Reach out proactively
- Act as a financial coach
- Keep clients updated
- Conduct goal-setting exercises on a regular basis
By communicating their value and setting expectations early, advisors can help prevent setbacks in their practice by adeptly recognizing the emotional motivators of their clients.
Markets in a Minute
The Top 5 Reasons Clients Hire a Financial Advisor
Here are the most common drivers for hiring a financial advisor, revealing that investor motivations go beyond just financial factors.

The Top 5 Reasons Clients Hire a Financial Advisor
What drives investors to hire a financial advisor?
From saving for a down payment to planning for retirement, clients turn to advisors to guide them through life’s complex financial decisions. However, many of the key reasons for hiring a financial advisor stem from emotional factors, and go beyond purely financial motivations.
We partnered with Morningstar to show the top reasons clients hire a financial advisor to provide insight on what’s driving investor behavior.
What Drives Hiring Decisions?
Here are the most common reasons for hiring an advisor, based on a survey of 312 respondents.
| Reason for Hiring | % of Respondents Citing This Reason | Type of Motivation |
|---|---|---|
| Specific goals or needs | 32% | Financial-based reason |
| Discomfort handling finances | 32% | Emotion-based reason |
| Behavioral coaching | 17% | Emotion-based reason |
| Recommended by family or friends | 12% | Emotion-based reason |
| Quality of relationship | 10% | Emotion-based reason |
Numbers may not total 100 due to rounding. Respondents could select more than one answer.
While financial factors played an important role in hiring decisions, emotional reasons made up the largest share of total responses.
This illustrates that clients place a high degree of importance on reaching specific goals or needs, and how an advisor communicates with them. Furthermore, clients seek out advisors for behavioral coaching to help them make informed decisions while staying the course.
Key Takeaways
With this in mind, here are five ways advisors can provide value to their clients and grow their practice:
- Address clients’ emotional needs early on
- Demonstrate how you can offer support
- Use ordinary language
- Provide education to help clients stay on track
- Acknowledge that these are issues we all face
By addressing emotional factors, advisors can more effectively help clients’ navigate intricate financial decisions and avoid common behavioral mistakes.

The Top 5 Reasons Clients Fire a Financial Advisor

The Top 5 Reasons Clients Hire a Financial Advisor

Visualizing the Growth of $100, by Asset Class

How Small Investments Make a Big Impact Over Time

What Were the Top Performing Investment Themes of 2023?
-

 Infographics2 years ago
The Top Investment Quotes Every Investor Should Know
-

 Markets in a Minute2 years ago
Mapped: The Growth in U.S. House Prices by State
-

 Markets in a Minute2 years ago
How Closely Related Are Historical Mortgage Rates and Housing Prices?
-

 Infographics2 years ago
A Visual Guide to Stagflation, Inflation, and Deflation
-

 Markets in a Minute1 year ago
Mapped: Global Energy Prices, by Country in 2022
-

 Infographics3 years ago
The 5 Fastest Growing Industries of the Next Decade
-

 Markets in a Minute2 years ago
Visualizing Historical Oil Prices (1968-2022)
-

 Infographics1 year ago
Visual Guide: The Three Types of Economic Indicators
