
Markets in a Minute
Visualizing the Three Different Types of Inflation
How to use: Arrows on side navigate between each type.

This infographic is available as a poster.
Visualizing Three Types of Inflation
Inflation is dominating the news as prices hit 40-year highs.
While the price of everyday goods, including food and energy, is the most widely cited type of inflation, other forms exist across the broader economic system.
In this Markets in a Minute from New York Life Investments, we chart three types of inflation and the macroeconomic factors that influence each type.
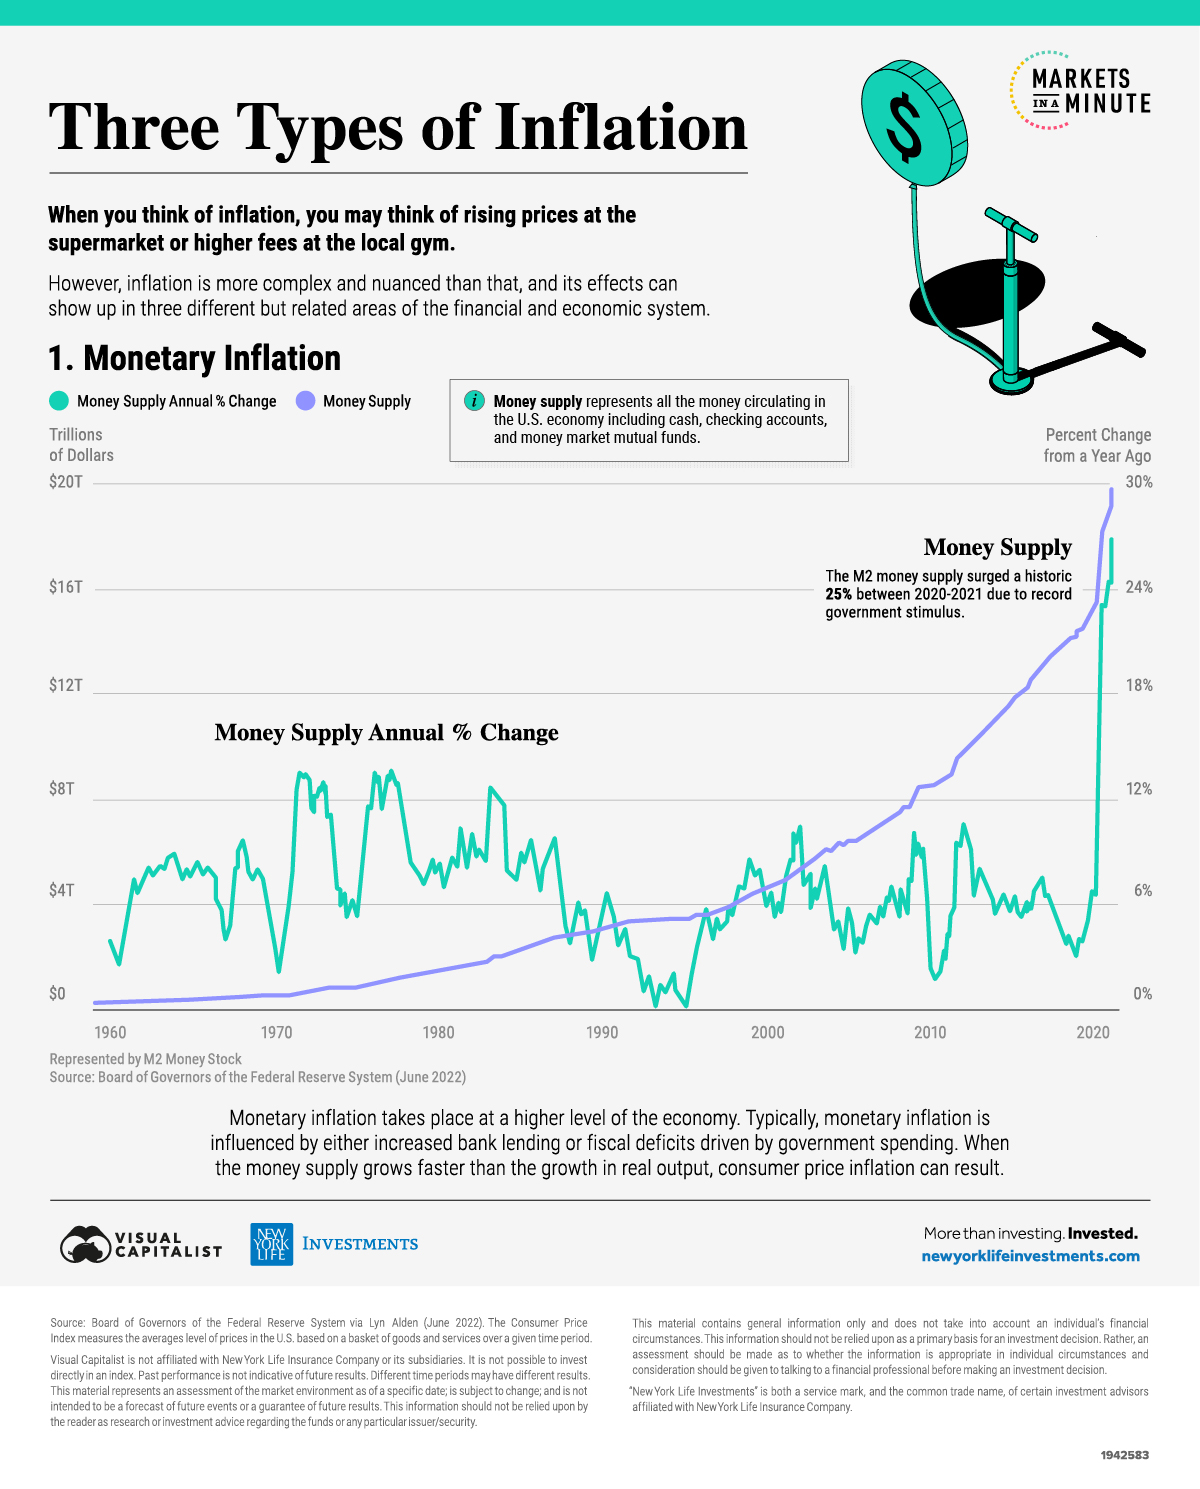
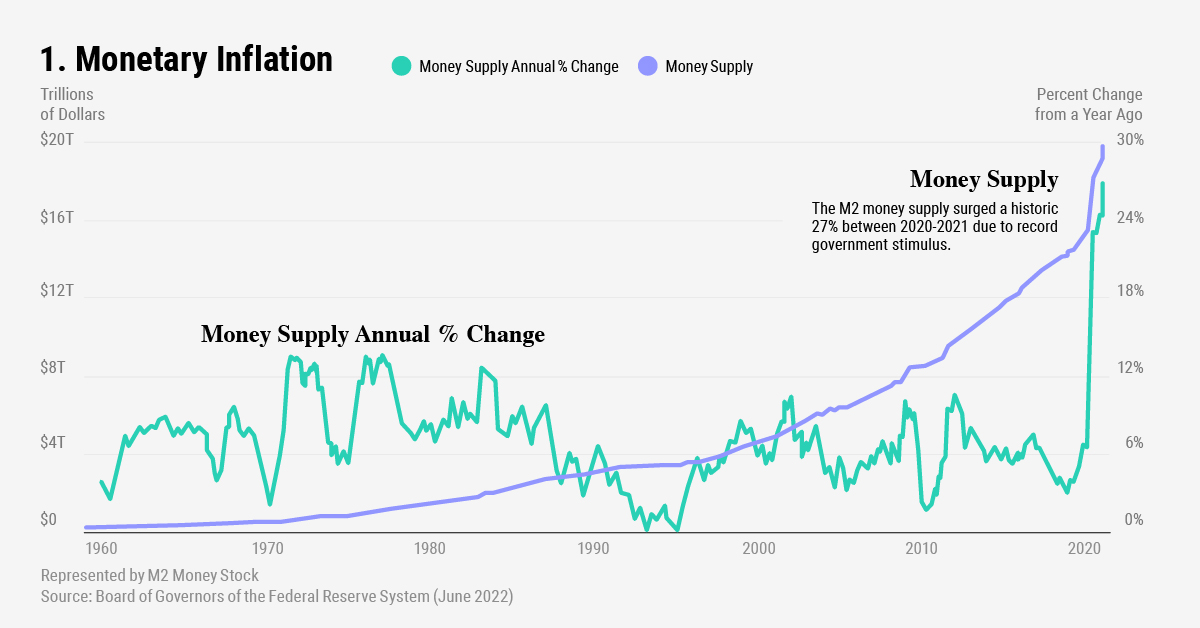
1. Monetary Inflation
Monetary inflation occurs when the U.S. money supply increases over time. This represents both physical and digital money circulating in the economy including cash, checking accounts, and money market mutual funds.
The U.S. central bank typically influences the money supply by printing money, buying bonds, or changing bank reserve requirements. The central bank controls the money supply in order to boost the economy or tame inflation and keep prices stable.
Between 2020-2021, the money supply increased roughly 25%—a historic record—in response to the COVID-19 crisis. Since then, the Federal Reserve began tapering its bond purchases as the economy showed signs of strength.
| Year | Money Supply | Annual Percent Change |
|---|---|---|
| 2022* | $21.7T | 0.9% |
| 2021 | $21.5T | 12.6% |
| 2020 | $19.1T | 24.8% |
| 2019 | $15.3T | 6.3% |
| 2018 | $14.4T | 3.6% |
| 2017 | $13.9T | 5.3% |
| 2016 | $13.2T | 7.3% |
| 2015 | $12.3T | 5.1% |
| 2014 | $11.7T | 6.4% |
| 2013 | $11.0T | 4.8% |
| 2012 | $10.5T | 8.2% |
| 2011 | $9.7T | 10.2% |
| 2010 | $8.8T | 6.0% |
| 2009 | $8.3T | 1.2% |
| 2008 | $8.2T | 9.3% |
| 2007 | $7.5T | 5.6% |
| 2006 | $7.1T | 6.0% |
| 2005 | $6.7T | 4.7% |
| 2004 | $6.4T | 4.9% |
| 2003 | $6.1T | 5.2% |
| 2002 | $5.8T | 7.4% |
| 2001 | $5.4T | 10.2% |
| 2000 | $4.9T | 6.5% |
| 1999 | $4.6T | 4.5% |
| 1998 | $4.4T | 10.0% |
| 1997 | $4.0T | 5.3% |
| 1996 | $3.8T | 5.6% |
| 1995 | $3.6T | 2.9% |
| 1994 | $3.5T | 0.0% |
| 1993 | $3.5T | 2.9% |
| 1992 | $3.4T | 0.0% |
| 1991 | $3.4T | 3.0% |
| 1990 | $3.3T | 3.1% |
| 1989 | $3.2T | 6.7% |
| 1988 | $3.0T | 7.1% |
| 1987 | $2.8T | 3.7% |
| 1986 | $2.7T | 8.0% |
| 1985 | $2.5T | 8.7% |
| 1984 | $2.3T | 9.5% |
| 1983 | $2.1T | 10.5% |
| 1982 | $1.9T | 5.6% |
| 1981 | $1.8T | 12.5% |
| 1980 | $1.6T | 14.3% |
| 1979 | $1.4T | 0.0% |
| 1978 | $1.4T | 7.7% |
| 1977 | $1.3T | 8.3% |
| 1976 | $1.2T | 20.0% |
| 1975 | $1.0T | -99.9% |
| 1974 | $902B | 5.4% |
| 1973 | $856B | 6.7% |
| 1972 | $802B | 13.0% |
| 1971 | $710B | 13.2% |
| 1970 | $627B | 6.6% |
Indicated by the M2 Money Stock.
*Data as of April 2022.
It’s worth noting that, in theory, increasing the money supply faster than the growth in real output may cause consumer price inflation, especially if the velocity of money (speed at which money exchanges hands) is high. The reason is that there is more money chasing the same number of goods, and this eventually leads to increases in prices.
2. Consumer Price Inflation
Consumer price inflation occurs when the prices of goods and services increase. It is typically measured by the Consumer Price Index (CPI), which shows the average price increase of a basket of goods, such as food, clothing, and housing.
Supply chain issues, geopolitical events, monetary supply, and consumer demand may all affect consumer price inflation.
Rising 8.6% in May year-over-year, the CPI hit its highest level in four decades. Russia’s invasion of Ukraine and COVID-19 have caused extensive disruption in supply chains, from oil to wheat, leading to increased price pressures worldwide.
| Year | CPI Annual Percent Change |
|---|---|
| 2022* | 8.6% |
| 2021 | 4.7% |
| 2020 | 1.2% |
| 2019 | 1.8% |
| 2018 | 2.4% |
| 2017 | 2.1% |
| 2016 | 1.3% |
| 2015 | 0.1% |
| 2014 | 1.6% |
| 2013 | 1.5% |
| 2012 | 2.1% |
| 2011 | 3.2% |
| 2010 | 1.6% |
| 2009 | -0.4% |
| 2008 | 3.8% |
| 2007 | 2.9% |
| 2006 | 3.2% |
| 2005 | 3.4% |
| 2004 | 2.7% |
| 2003 | 2.3% |
| 2002 | 1.6% |
| 2001 | 2.8% |
| 2000 | 3.4% |
| 1999 | 2.2% |
| 1998 | 1.6% |
| 1997 | 2.3% |
| 1996 | 2.9% |
| 1995 | 2.8% |
| 1994 | 2.6% |
| 1993 | 3.0% |
| 1992 | 3.0% |
| 1991 | 4.2% |
| 1990 | 5.4% |
| 1989 | 4.8% |
| 1988 | 4.1% |
| 1987 | 3.7% |
| 1986 | 1.9% |
| 1985 | 3.5% |
| 1984 | 4.3% |
| 1983 | 3.2% |
| 1982 | 6.1% |
| 1981 | 10.3% |
| 1980 | 13.5% |
| 1979 | 11.3% |
| 1978 | 7.6% |
| 1977 | 6.5% |
| 1976 | 5.7% |
| 1975 | 9.1% |
| 1974 | 11.1% |
| 1973 | 6.2% |
| 1972 | 3.3% |
| 1971 | 4.3% |
| 1970 | 5.8% |
| 1969 | 5.5% |
| 1968 | 4.3% |
| 1967 | 2.8% |
| 1966 | 3.0% |
| 1965 | 1.6% |
| 1964 | 1.3% |
| 1963 | 1.2% |
| 1962 | 1.2% |
| 1961 | 1.1% |
| 1960 | 1.5% |
| 1959 | 1.0% |
| 1958 | 2.7% |
| 1957 | 3.3% |
| 1956 | 1.5% |
| 1955 | -0.3% |
| 1954 | 0.3% |
| 1953 | 0.8% |
| 1952 | 2.3% |
| 1951 | 7.9% |
| 1950 | 1.1% |
| 1949 | -1.0% |
| 1948 | 7.7% |
| 1947 | 14.4% |
| 1946 | 8.5% |
| 1945 | 2.3% |
| 1944 | 1.6% |
| 1943 | 6.0% |
| 1942 | 10.9% |
| 1941 | 5.1% |
| 1940 | 0.7% |
| 1939 | -1.3% |
| 1938 | -2.0% |
| 1937 | 3.7% |
| 1936 | 1.0% |
| 1935 | 2.6% |
| 1934 | 3.5% |
| 1933 | -5.2% |
| 1932 | -10.3% |
| 1931 | -8.9% |
| 1930 | -2.7% |
*Data for 2022 shows the year-over-year change from May 2021 to May 2022.
When consumer price inflation gets too heated, the central bank may increase interest rates to curtail spending and allow prices to cool down.
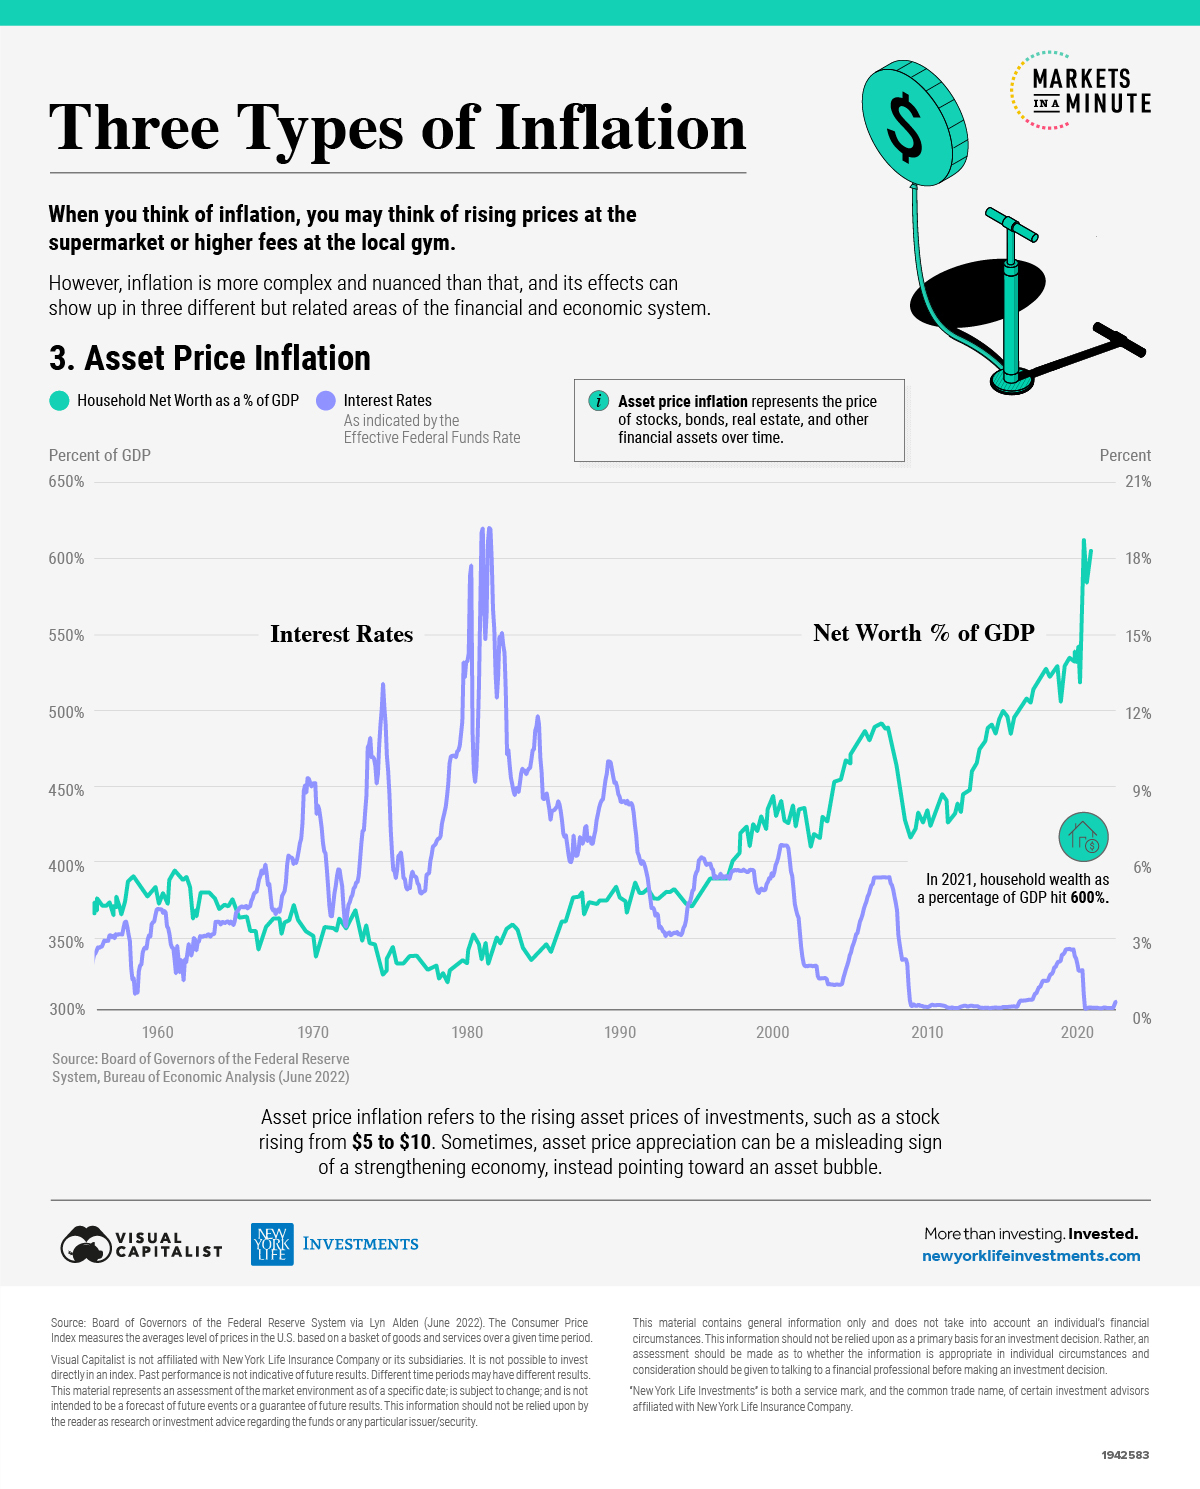
3. Asset-Price Inflation
Finally, asset-price inflation represents the price increase of stocks, bonds, real estate, and other financial assets over time. While there are a number of ways to show asset-price inflation, we will use household net worth as a percentage of GDP.
Often, a low interest rate climate creates a favorable environment for asset prices. This can be seen over the last decade as low borrowing costs were met with rising asset prices and strong investor confidence. In 2021, household net worth as a percentage of GDP stood at 620%.
| Year | U.S. Interest Rate | Household Net Worth as a % of GDP |
|---|---|---|
| 2021 | 0.1% | 620% |
| 2020 | 0.1% | 510% |
| 2019 | 1.6% | 520% |
| 2018 | 2.4% | 520% |
| 2017 | 1.3% | 510% |
| 2016 | 0.6% | 490% |
| 2015 | 0.2% | 490% |
| 2014 | 0.1% | 480% |
| 2013 | 0.1% | 450% |
| 2012 | 0.1% | 430% |
| 2011 | 0.0% | 440% |
| 2010 | 0.1% | 430% |
| 2009 | 0.1% | 410% |
| 2008 | 0.1% | 460% |
| 2007 | 3.1% | 490% |
| 2006 | 5.2% | 480% |
| 2005 | 4.1% | 460% |
| 2004 | 2.0% | 450% |
| 2003 | 0.9% | 410% |
| 2002 | 1.2% | 430% |
| 2001 | 1.5% | 420% |
| 2000 | 5.4% | 440% |
| 1999 | 4.0% | 420% |
| 1998 | 4.1% | 420% |
| 1997 | 5.8% | 390% |
| 1996 | 6.3% | 390% |
| 1995 | 4.7% | 370% |
| 1994 | 4.9% | 380% |
| 1993 | 2.9% | 380% |
| 1992 | 2.7% | 380% |
| 1991 | 4.1% | 380% |
| 1990 | 5.5% | 380% |
| 1989 | 8.0% | 370% |
| 1988 | 9.0% | 370% |
| 1987 | 6.9% | 380% |
| 1986 | 14.4% | 360% |
| 1985 | 13.5% | 340% |
| 1984 | 8.7% | 340% |
| 1983 | 9.9% | 360% |
| 1982 | 11.2% | 350% |
| 1981 | 13.1% | 340% |
| 1980 | 22.0% | 330% |
| 1979 | 14.8% | 330% |
| 1978 | 10.8% | 330% |
| 1977 | 6.5% | 330% |
| 1976 | 4.2% | 330% |
| 1975 | 5.4% | 340% |
| 1974 | 3.9% | 340% |
| 1973 | 9.8% | 360% |
| 1972 | 5.5% | 360% |
| 1971 | 3.0% | 360% |
| 1970 | 3.0% | 350% |
| 1969 | 5.0% | 360% |
| 1968 | 4.0% | 350% |
| 1967 | 4.5% | 360% |
| 1966 | 5.0% | 350% |
| 1965 | 4.6% | 370% |
| 1964 | 4.0% | 370% |
| 1963 | 3.3% | 380% |
| 1962 | 3.0% | 380% |
| 1961 | 2.5% | 390% |
| 1960 | 3.0% | 370% |
| 1959 | 4.0% | 380% |
| 1958 | 2.4% | 390% |
| 1957 | 3.0% | 370% |
| 1956 | 3.0% | 370% |
| 1955 | 2.5% | 360% |
Interest rates indicated by the Effective Federal Funds Rate
Sometimes rising asset prices can be a misleading sign of a strengthening economy since no real output is produced. Instead, this may indicate an asset bubble.
How the Types of Inflation Impact You
With monetary inflation, businesses and consumers have more money at their disposal, which could then boost demand and further increase inflation in the overall economy.
However, the degree that this impacts consumer price inflation can be unclear. Over the last decade, the money supply ballooned but consumer price inflation stayed relatively stable. Instead, supply shocks seen with COVID-19 and the invasion of Ukraine have had a more immediate effect. The effect of this scarcity in goods has made prices more sensitive to demand. This can be seen with gasoline prices at record highs.
When it comes to asset price inflation, a significant increase to the monetary supply and low interest rates are likely factors behind rising asset prices, among other variables. Yet as the Federal Reserve takes a more hawkish stance on monetary policy, the future of asset price inflation remains to be seen.


Markets in a Minute
The Top 5 Reasons Clients Fire a Financial Advisor
Firing an advisor is often driven by more than cost and performance factors. Here are the top reasons clients ‘break up’ with their advisors.

The Top 5 Reasons Clients Fire a Financial Advisor
What drives investors to fire a financial advisor?
From saving for a down payment to planning for retirement, clients turn to advisors to guide them through life’s complex financial decisions. However, many of the key reasons for firing a financial advisor stem from emotional factors, and go beyond purely financial motivations.
We partnered with Morningstar to show the top reasons clients fire an advisor to provide insight on what’s driving investor behavior.
What Drives Firing Decisions?
Here are the top reasons clients terminated their advisor, based on a survey of 184 respondents:
| Reason for Firing | % of Respondents Citing This Reason | Type of Motivation |
|---|---|---|
| Quality of financial advice and services | 32% | Emotion-based reason |
| Quality of relationship | 21% | Emotion-based reason |
| Cost of services | 17% | Financial-based reason |
| Return performance | 11% | Financial-based reason |
| Comfort handling financial issues on their own | 10% | Emotion-based reason |
Numbers may not total 100 due to rounding. Respondents could select more than one answer.
Numbers may not total 100 due to rounding. Respondents could select more than one answer.
While firing an advisor is rare, many of the primary drivers behind firing decisions are also emotionally driven.
Often, advisors were fired due to the quality of the relationship. In many cases, this was due to an advisor not dedicating enough time to fully grasp their personal financial goals. Additionally, wealthier, and more financially literate clients are more likely to fire their advisors—highlighting the importance of understanding the client.
Key Takeaways
Given these driving factors, here are five ways that advisors can build a lasting relationship through recognizing their clients’ emotional needs:
- Understand your clients’ deeper goals
- Reach out proactively
- Act as a financial coach
- Keep clients updated
- Conduct goal-setting exercises on a regular basis
By communicating their value and setting expectations early, advisors can help prevent setbacks in their practice by adeptly recognizing the emotional motivators of their clients.
Markets in a Minute
The Top 5 Reasons Clients Hire a Financial Advisor
Here are the most common drivers for hiring a financial advisor, revealing that investor motivations go beyond just financial factors.

The Top 5 Reasons Clients Hire a Financial Advisor
What drives investors to hire a financial advisor?
From saving for a down payment to planning for retirement, clients turn to advisors to guide them through life’s complex financial decisions. However, many of the key reasons for hiring a financial advisor stem from emotional factors, and go beyond purely financial motivations.
We partnered with Morningstar to show the top reasons clients hire a financial advisor to provide insight on what’s driving investor behavior.
What Drives Hiring Decisions?
Here are the most common reasons for hiring an advisor, based on a survey of 312 respondents.
| Reason for Hiring | % of Respondents Citing This Reason | Type of Motivation |
|---|---|---|
| Specific goals or needs | 32% | Financial-based reason |
| Discomfort handling finances | 32% | Emotion-based reason |
| Behavioral coaching | 17% | Emotion-based reason |
| Recommended by family or friends | 12% | Emotion-based reason |
| Quality of relationship | 10% | Emotion-based reason |
Numbers may not total 100 due to rounding. Respondents could select more than one answer.
While financial factors played an important role in hiring decisions, emotional reasons made up the largest share of total responses.
This illustrates that clients place a high degree of importance on reaching specific goals or needs, and how an advisor communicates with them. Furthermore, clients seek out advisors for behavioral coaching to help them make informed decisions while staying the course.
Key Takeaways
With this in mind, here are five ways advisors can provide value to their clients and grow their practice:
- Address clients’ emotional needs early on
- Demonstrate how you can offer support
- Use ordinary language
- Provide education to help clients stay on track
- Acknowledge that these are issues we all face
By addressing emotional factors, advisors can more effectively help clients’ navigate intricate financial decisions and avoid common behavioral mistakes.

The Top 5 Reasons Clients Fire a Financial Advisor

The Top 5 Reasons Clients Hire a Financial Advisor

Visualizing the Growth of $100, by Asset Class

How Small Investments Make a Big Impact Over Time

What Were the Top Performing Investment Themes of 2023?
-

 Infographics2 years ago
The Top Investment Quotes Every Investor Should Know
-

 Markets in a Minute2 years ago
Mapped: The Growth in U.S. House Prices by State
-

 Markets in a Minute2 years ago
How Closely Related Are Historical Mortgage Rates and Housing Prices?
-

 Infographics2 years ago
A Visual Guide to Stagflation, Inflation, and Deflation
-

 Markets in a Minute1 year ago
Mapped: Global Energy Prices, by Country in 2022
-

 Infographics3 years ago
The 5 Fastest Growing Industries of the Next Decade
-

 Markets in a Minute2 years ago
Visualizing Historical Oil Prices (1968-2022)
-

 Infographics1 year ago
Visual Guide: The Three Types of Economic Indicators
