
Markets in a Minute
Ranked: The Largest Bond Markets in the World
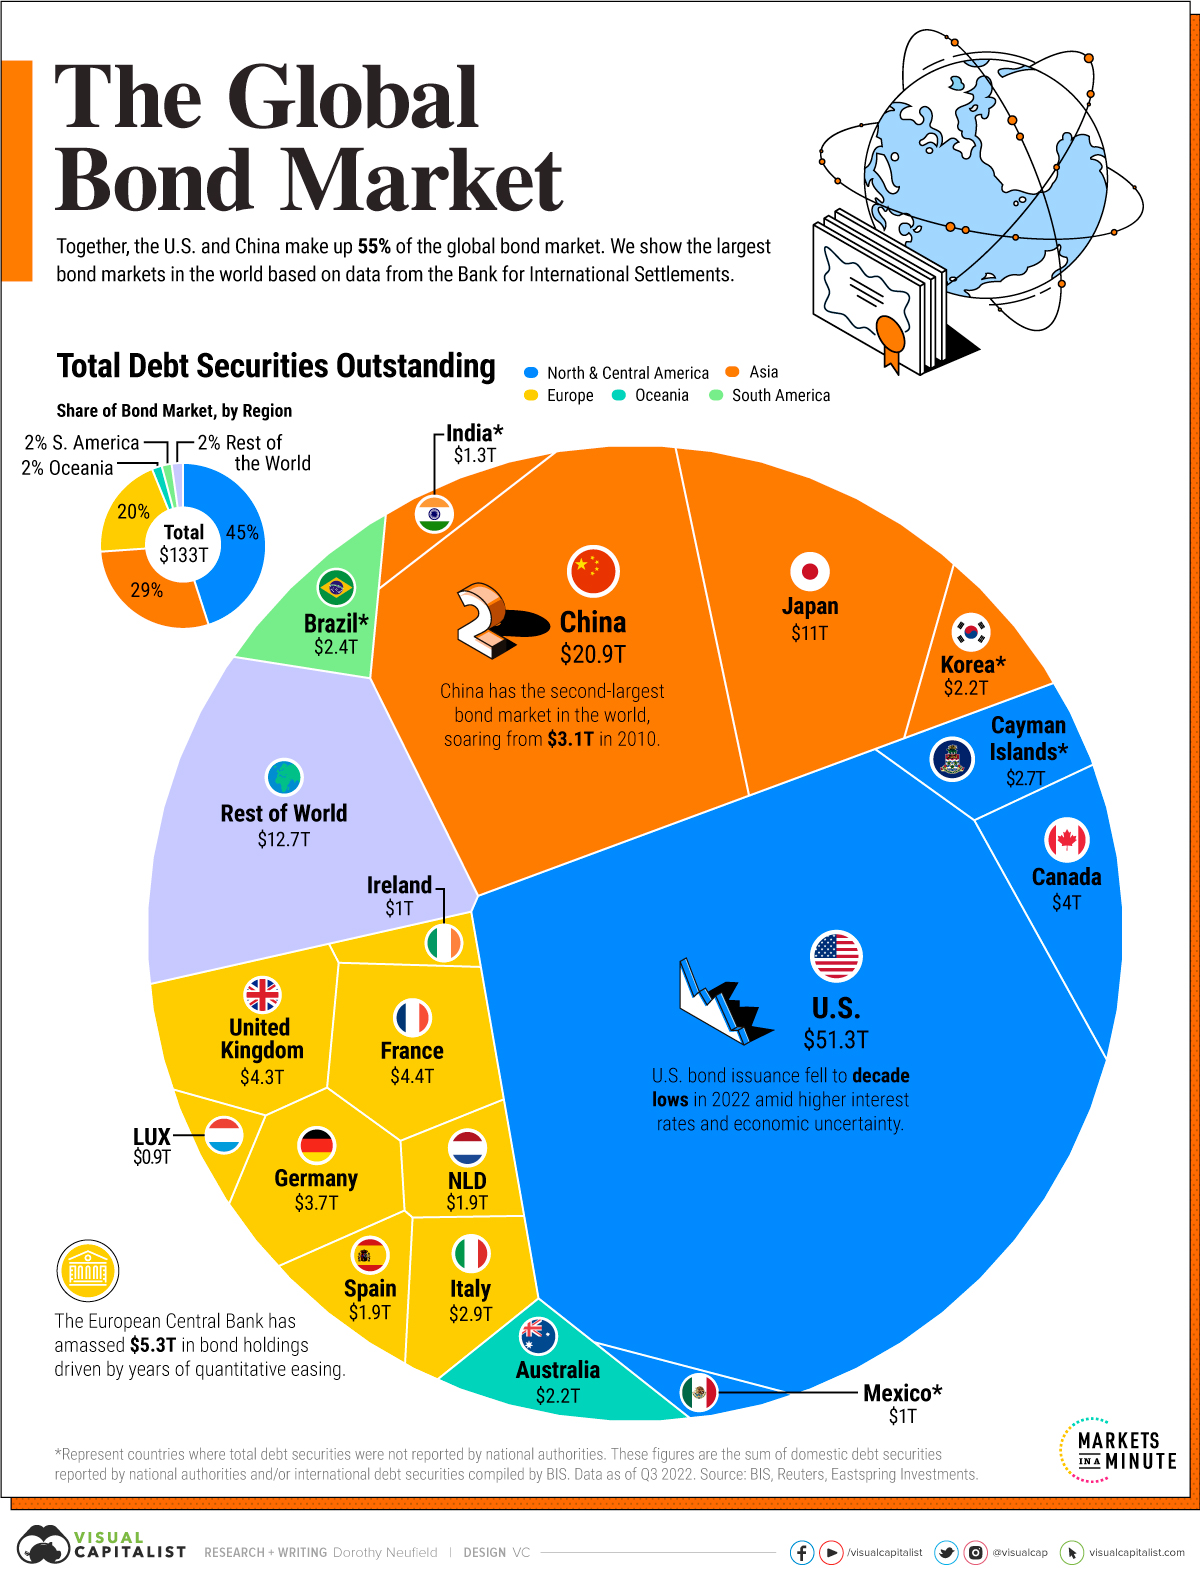
The Largest Bond Markets in the World
In 2022, the global bond market totaled $133 trillion.
As one of the world’s largest capital markets, debt securities have grown sevenfold over the last 40 years. Fueling this growth are government and corporate debt sales across major economies and emerging markets. Over the last three years, China’s bond market has grown 13% annually.
Based on estimates from the Bank for International Statements, this graphic shows the largest bond markets in the world.
Ranked: The World’s Top Bond Markets
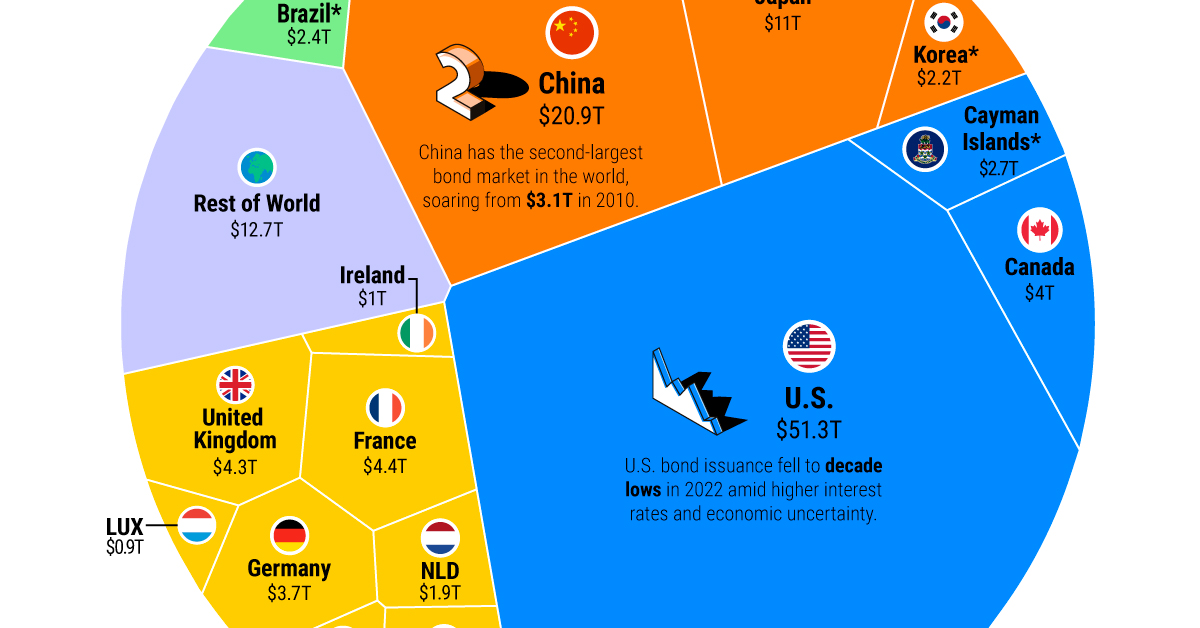
Valued at over $51 trillion, the U.S. has the largest bond market globally.
Government bonds made up the majority of its debt market, with over $26 trillion in securities outstanding. In 2022, the Federal government paid $534 billion in interest on this debt.
China is second, at 16% of the global total. Local commercial banks hold the greatest share of its outstanding bonds, while foreign ownership remains fairly low. Foreign interest in China’s bonds slowed in 2022 amid geopolitical tensions in Ukraine and lower yields.
| Bond Market Rank | Country / Region | Total Debt Outstanding | Share of Total Bond Market |
|---|---|---|---|
| 1 | 🇺🇸 U.S. | $51.3T | 39% |
| 2 | 🇨🇳 China | $20.9T | 16% |
| 3 | 🇯🇵 Japan | $11.0T | 8% |
| 4 | 🇫🇷 France | $4.4T | 3% |
| 5 | 🇬🇧 United Kingdom | $4.3T | 3% |
| 6 | 🇨🇦 Canada | $4.0T | 3% |
| 7 | 🇩🇪 Germany | $3.7T | 3% |
| 8 | 🇮🇹 Italy | $2.9T | 2% |
| 9 | 🇰🇾 Cayman Islands* | $2.7T | 2% |
| 10 | 🇧🇷 Brazil* | $2.4T | 2% |
| 11 | 🇰🇷 South Korea* | $2.2T | 2% |
| 12 | 🇦🇺 Australia | $2.2T | 2% |
| 13 | 🇳🇱 Netherlands | $1.9T | 1% |
| 14 | 🇪🇸 Spain | $1.9T | 1% |
| 15 | 🇮🇳 India* | $1.3T | 1% |
| 16 | 🇮🇪 Ireland | $1.0T | 1% |
| 17 | 🇲🇽 Mexico* | $1.0T | 1% |
| 18 | 🇱🇺 Luxembourg | $0.9T | 1% |
| 19 | 🇧🇪 Belgium | $0.7T | >1% |
| 20 | 🇷🇺 Russia* | $0.7T | >1% |
*Represent countries where total debt securities were not reported by national authorities. These figures are the sum of domestic debt securities reported by national authorities and/or international debt securities compiled by BIS.
Data as of Q3 2022.
As the above table shows, Japan has the third biggest debt market. Japan’s central bank owns a massive share of its government bonds. Central bank ownership hit a record 50% as it tweaked its yield curve control policy that was introduced in 2016. The policy was designed to help boost inflation and prevent interest rates from falling. As inflation began to rise in 2022 and bond investors began selling, it had to increase its yield to spur demand and liquidity. The adjustment sent shockwaves through financial markets.
In Europe, France is home to the largest bond market at $4.4 trillion in total debt, surpassing the United Kingdom by roughly $150 billion.
Banks: A Major Buyer in Bond Markets
Like central banks around the world, commercial banks are key players in bond markets.
In fact, commercial banks are among the top three buyers of U.S. government debt. This is because commercial banks will reinvest client deposits into interest-bearing securities. These often include U.S. Treasuries, which are highly liquid and one of the safest assets globally.
As we can see in the chart below, the banking sector often surpasses an economy’s total GDP.
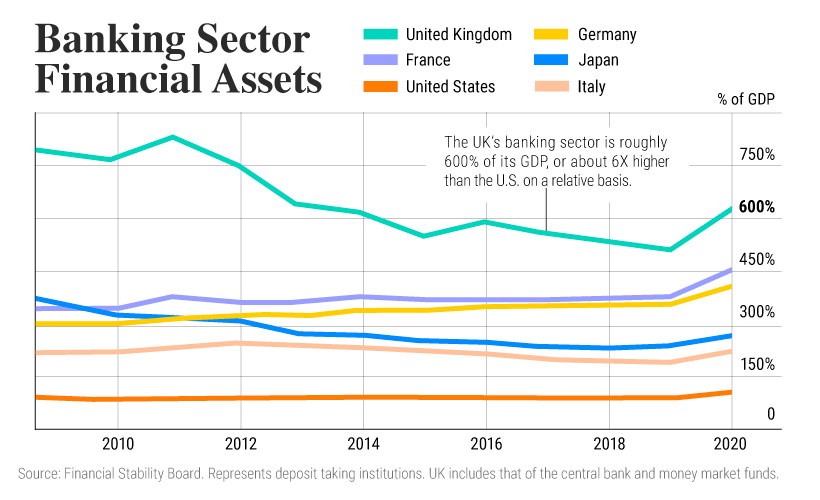
As interest rates have risen sharply since 2022, the price of bonds has been pushed down, given their inverse relationship. This has raised questions about what type of bonds banks hold.
In the U.S., commercial banks hold $4.2 trillion in Treasury bonds and other government securities. For large U.S. banks, these holdings account for almost 24% of assets on average. They make up an average 15% of assets for small banks in 2023. Since mid-2022, small banks have reduced their bond holdings due to interest rate increases.
As higher rates reverberate across the banking system and wider economy, it may expose further strains on global bond markets which have expanded rapidly in an era of dovish monetary policy and ultra-low interest rates.


Markets in a Minute
The Top 5 Reasons Clients Fire a Financial Advisor
Firing an advisor is often driven by more than cost and performance factors. Here are the top reasons clients ‘break up’ with their advisors.

The Top 5 Reasons Clients Fire a Financial Advisor
What drives investors to fire a financial advisor?
From saving for a down payment to planning for retirement, clients turn to advisors to guide them through life’s complex financial decisions. However, many of the key reasons for firing a financial advisor stem from emotional factors, and go beyond purely financial motivations.
We partnered with Morningstar to show the top reasons clients fire an advisor to provide insight on what’s driving investor behavior.
What Drives Firing Decisions?
Here are the top reasons clients terminated their advisor, based on a survey of 184 respondents:
| Reason for Firing | % of Respondents Citing This Reason | Type of Motivation |
|---|---|---|
| Quality of financial advice and services | 32% | Emotion-based reason |
| Quality of relationship | 21% | Emotion-based reason |
| Cost of services | 17% | Financial-based reason |
| Return performance | 11% | Financial-based reason |
| Comfort handling financial issues on their own | 10% | Emotion-based reason |
Numbers may not total 100 due to rounding. Respondents could select more than one answer.
Numbers may not total 100 due to rounding. Respondents could select more than one answer.
While firing an advisor is rare, many of the primary drivers behind firing decisions are also emotionally driven.
Often, advisors were fired due to the quality of the relationship. In many cases, this was due to an advisor not dedicating enough time to fully grasp their personal financial goals. Additionally, wealthier, and more financially literate clients are more likely to fire their advisors—highlighting the importance of understanding the client.
Key Takeaways
Given these driving factors, here are five ways that advisors can build a lasting relationship through recognizing their clients’ emotional needs:
- Understand your clients’ deeper goals
- Reach out proactively
- Act as a financial coach
- Keep clients updated
- Conduct goal-setting exercises on a regular basis
By communicating their value and setting expectations early, advisors can help prevent setbacks in their practice by adeptly recognizing the emotional motivators of their clients.
Markets in a Minute
The Top 5 Reasons Clients Hire a Financial Advisor
Here are the most common drivers for hiring a financial advisor, revealing that investor motivations go beyond just financial factors.

The Top 5 Reasons Clients Hire a Financial Advisor
What drives investors to hire a financial advisor?
From saving for a down payment to planning for retirement, clients turn to advisors to guide them through life’s complex financial decisions. However, many of the key reasons for hiring a financial advisor stem from emotional factors, and go beyond purely financial motivations.
We partnered with Morningstar to show the top reasons clients hire a financial advisor to provide insight on what’s driving investor behavior.
What Drives Hiring Decisions?
Here are the most common reasons for hiring an advisor, based on a survey of 312 respondents.
| Reason for Hiring | % of Respondents Citing This Reason | Type of Motivation |
|---|---|---|
| Specific goals or needs | 32% | Financial-based reason |
| Discomfort handling finances | 32% | Emotion-based reason |
| Behavioral coaching | 17% | Emotion-based reason |
| Recommended by family or friends | 12% | Emotion-based reason |
| Quality of relationship | 10% | Emotion-based reason |
Numbers may not total 100 due to rounding. Respondents could select more than one answer.
While financial factors played an important role in hiring decisions, emotional reasons made up the largest share of total responses.
This illustrates that clients place a high degree of importance on reaching specific goals or needs, and how an advisor communicates with them. Furthermore, clients seek out advisors for behavioral coaching to help them make informed decisions while staying the course.
Key Takeaways
With this in mind, here are five ways advisors can provide value to their clients and grow their practice:
- Address clients’ emotional needs early on
- Demonstrate how you can offer support
- Use ordinary language
- Provide education to help clients stay on track
- Acknowledge that these are issues we all face
By addressing emotional factors, advisors can more effectively help clients’ navigate intricate financial decisions and avoid common behavioral mistakes.

The Top 5 Reasons Clients Fire a Financial Advisor

The Top 5 Reasons Clients Hire a Financial Advisor

Visualizing the Growth of $100, by Asset Class

How Small Investments Make a Big Impact Over Time

What Were the Top Performing Investment Themes of 2023?
-

 Infographics2 years ago
The Top Investment Quotes Every Investor Should Know
-

 Markets in a Minute2 years ago
Mapped: The Growth in U.S. House Prices by State
-

 Markets in a Minute2 years ago
How Closely Related Are Historical Mortgage Rates and Housing Prices?
-

 Infographics2 years ago
A Visual Guide to Stagflation, Inflation, and Deflation
-

 Markets in a Minute1 year ago
Mapped: Global Energy Prices, by Country in 2022
-

 Infographics3 years ago
The 5 Fastest Growing Industries of the Next Decade
-

 Markets in a Minute2 years ago
Visualizing Historical Oil Prices (1968-2022)
-

 Infographics1 year ago
Visual Guide: The Three Types of Economic Indicators
