
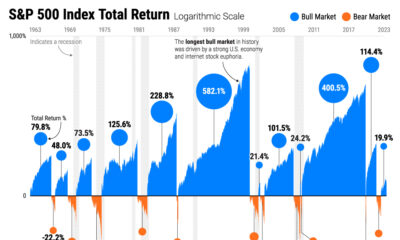

Stock market cycles often rhyme throughout history, shaped by monetary policy, consumer spending, and herd behaviour.
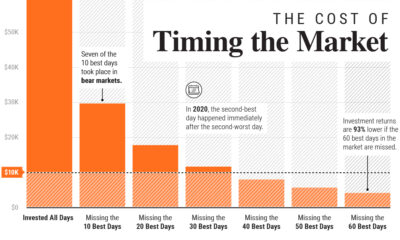

In this graphic, we show why timing the market is extremely difficult, and how it can meaningfully dent portfolio returns.
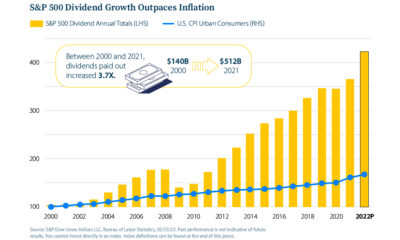

This infographic looks at the key fundamentals and market sectors that have been historically resilient during down markets.
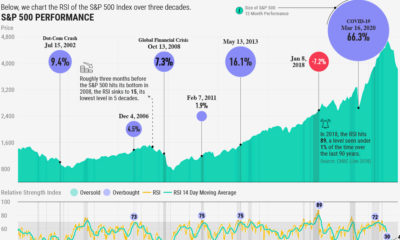

When is the S&P 500 Index considered overbought or oversold? The relative strength index may offer some answers to identifying market trends.


