
Markets in a Minute
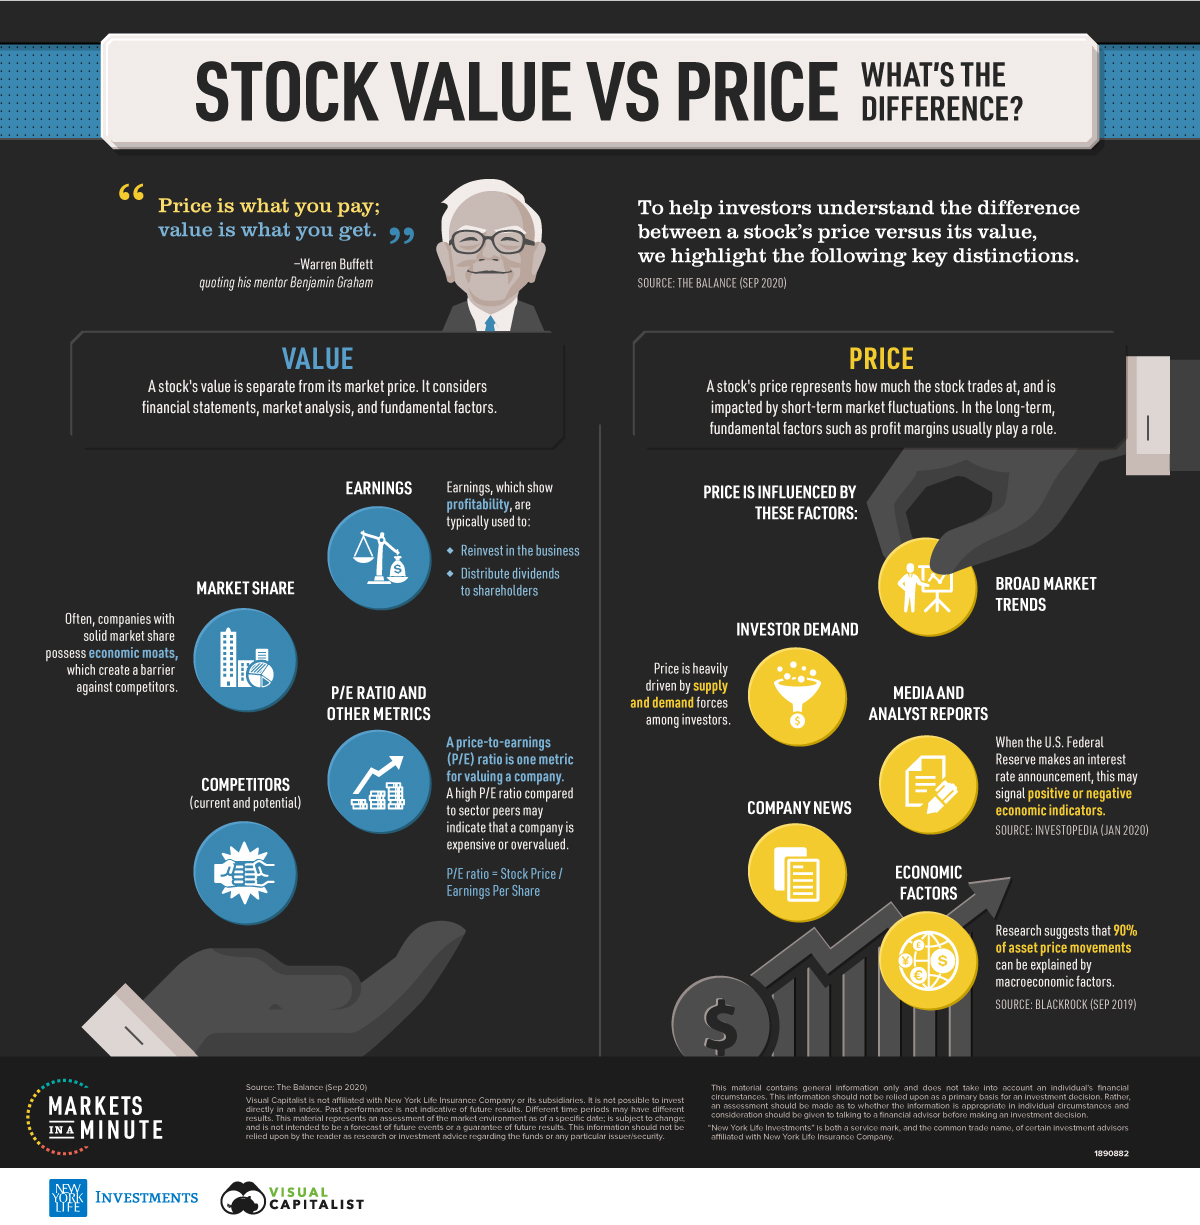
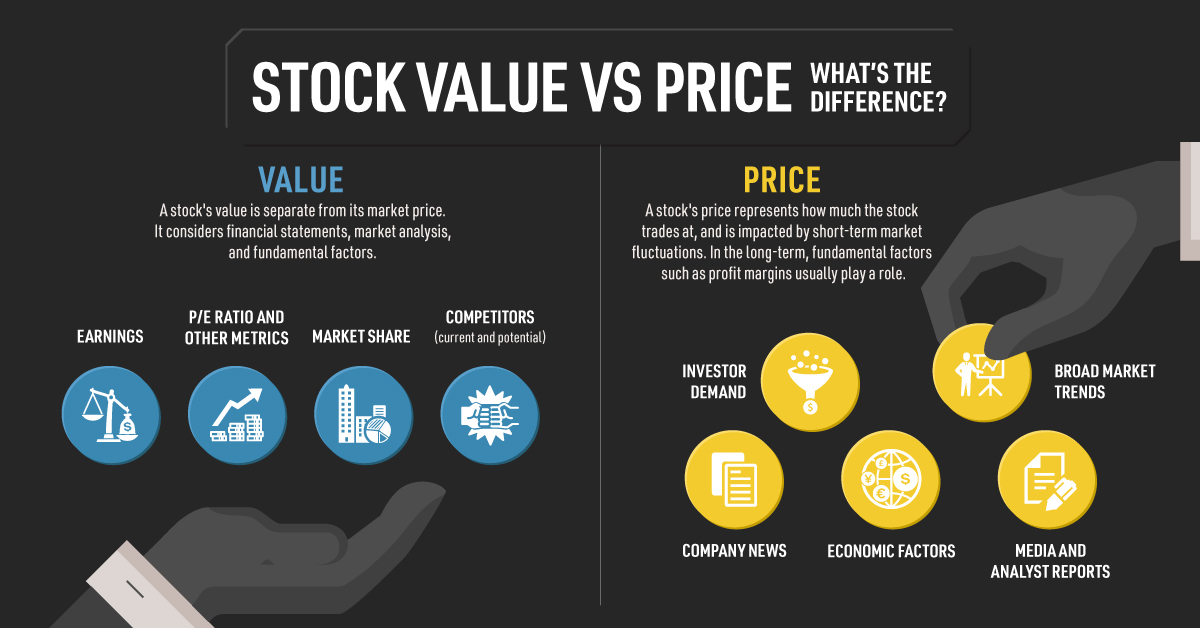
Stock Value vs. Price: What’s the Difference?
This infographic is available as a poster.
This infographic is available as a poster.
Stock Value vs. Price: What’s the Difference?
From the Dutch Tulip Mania of the 17th century to the Roaring Twenties, asset bubbles have cropped up in markets persistently.
The recent activity in GameStop and other securities are no exception. But what does this mean for investors today? To answer this question, we return to a key principle of investing: the difference between a stock’s price versus its value.
This Markets in a Minute chart from New York Life Investments shows the key forces that impact both price and value to help investors harness a deeper understanding of their investments.
What Determines a Stock’s Value?
A company (represented by a stock) derives its value from fundamental factors including:
Earnings
Earnings, or profitability, is often an indicator of company performance. Past and present numbers indicate a company’s profitability thus far, while future earning projections help investors gauge potential performance going forward. This is germane to investors because a company will typically reinvest its earnings into the business or distribute them as dividends to investors.
Market Share
Companies with strong market share possess economic moats, which create a barrier against competitors. These moats can protect a company from new market entrants or allow for cost advantages, increasing the company’s value to investors.
P/E ratio and Other Metrics
The price-to-earnings (P/E) ratio is a common metric for valuing companies. It measures a company’s price in relation to its earnings per share (EPS). If a company has a low P/E ratio compared to its peers, this may suggest that it is undervalued.
Here are common metrics used to value a stock:
| Metric | Formula | Purpose |
|---|---|---|
| P/E ratio | Price/Earnings Per Share | Compares a company’s stock price relative to its earnings |
| P/B ratio | Price/Book Value Per Share | Compares a company’s stock price relative to its tangible net asset value |
| Debt-to-equity ratio | Total Liabilities/Total Shareholders’ Equity | Shows company leverage, or the extent that a company is financing operations through debt |
Competitors (Current and Potential)
Comparing a company against its peers can indicate its relative strength. An investor may discover value discrepancies between competitors, presenting potential investment opportunities.
What Determines a Stock’s Price?
A stock’s price, on the other hand, is typically influenced by a separate set of factors:
Investor Demand
Supply and demand is central to determining the price of a stock. When an influx of market participants are buying a stock, the market price will rise. If the number of sellers for a stock exceeds the number of buyers, the price may drop.
Broad Market Trends
Bull and bear markets are examples of primary markets, which may influence a stock’s price performance. Rallies or directional turnarounds are other types of shorter market trends which often last between two to eight weeks.
Media and Analyst Reports
When a company faces a controversy, media reports may influence investor behavior, causing them to sell. Conversely, a strong analyst rating may influence investors to buy.
Economic Factors
Across asset classes, six macroeconomic factors have been shown to explain 90% of a stock price’s movements: real rates, economic growth, liquidity, inflation, emerging markets, and credit.
Company News
When a company releases quarterly earnings reports, it may influence investor demand. If Apple’s company’s earnings exceed expectations, for instance, its stock price may consequently rise after the announcement.
In the short term, many of the variables that influence a stock’s price are driven by external forces. But in the long term, fundamental factors such as profit margins or earnings, often play a bigger role.
Forest For the Trees
With the above factors in mind, investors are better equipped to recognize the driving forces that underscore a stock’s price and value, especially in the face of volatility and market exuberance.
By knowing these core differences, investors will not only get a better awareness of their portfolios, but will learn how to make more rational investment decisions.


Markets in a Minute
The Top 5 Reasons Clients Fire a Financial Advisor
Firing an advisor is often driven by more than cost and performance factors. Here are the top reasons clients ‘break up’ with their advisors.

The Top 5 Reasons Clients Fire a Financial Advisor
What drives investors to fire a financial advisor?
From saving for a down payment to planning for retirement, clients turn to advisors to guide them through life’s complex financial decisions. However, many of the key reasons for firing a financial advisor stem from emotional factors, and go beyond purely financial motivations.
We partnered with Morningstar to show the top reasons clients fire an advisor to provide insight on what’s driving investor behavior.
What Drives Firing Decisions?
Here are the top reasons clients terminated their advisor, based on a survey of 184 respondents:
| Reason for Firing | % of Respondents Citing This Reason | Type of Motivation |
|---|---|---|
| Quality of financial advice and services | 32% | Emotion-based reason |
| Quality of relationship | 21% | Emotion-based reason |
| Cost of services | 17% | Financial-based reason |
| Return performance | 11% | Financial-based reason |
| Comfort handling financial issues on their own | 10% | Emotion-based reason |
Numbers may not total 100 due to rounding. Respondents could select more than one answer.
Numbers may not total 100 due to rounding. Respondents could select more than one answer.
While firing an advisor is rare, many of the primary drivers behind firing decisions are also emotionally driven.
Often, advisors were fired due to the quality of the relationship. In many cases, this was due to an advisor not dedicating enough time to fully grasp their personal financial goals. Additionally, wealthier, and more financially literate clients are more likely to fire their advisors—highlighting the importance of understanding the client.
Key Takeaways
Given these driving factors, here are five ways that advisors can build a lasting relationship through recognizing their clients’ emotional needs:
- Understand your clients’ deeper goals
- Reach out proactively
- Act as a financial coach
- Keep clients updated
- Conduct goal-setting exercises on a regular basis
By communicating their value and setting expectations early, advisors can help prevent setbacks in their practice by adeptly recognizing the emotional motivators of their clients.
Markets in a Minute
The Top 5 Reasons Clients Hire a Financial Advisor
Here are the most common drivers for hiring a financial advisor, revealing that investor motivations go beyond just financial factors.

The Top 5 Reasons Clients Hire a Financial Advisor
What drives investors to hire a financial advisor?
From saving for a down payment to planning for retirement, clients turn to advisors to guide them through life’s complex financial decisions. However, many of the key reasons for hiring a financial advisor stem from emotional factors, and go beyond purely financial motivations.
We partnered with Morningstar to show the top reasons clients hire a financial advisor to provide insight on what’s driving investor behavior.
What Drives Hiring Decisions?
Here are the most common reasons for hiring an advisor, based on a survey of 312 respondents.
| Reason for Hiring | % of Respondents Citing This Reason | Type of Motivation |
|---|---|---|
| Specific goals or needs | 32% | Financial-based reason |
| Discomfort handling finances | 32% | Emotion-based reason |
| Behavioral coaching | 17% | Emotion-based reason |
| Recommended by family or friends | 12% | Emotion-based reason |
| Quality of relationship | 10% | Emotion-based reason |
Numbers may not total 100 due to rounding. Respondents could select more than one answer.
While financial factors played an important role in hiring decisions, emotional reasons made up the largest share of total responses.
This illustrates that clients place a high degree of importance on reaching specific goals or needs, and how an advisor communicates with them. Furthermore, clients seek out advisors for behavioral coaching to help them make informed decisions while staying the course.
Key Takeaways
With this in mind, here are five ways advisors can provide value to their clients and grow their practice:
- Address clients’ emotional needs early on
- Demonstrate how you can offer support
- Use ordinary language
- Provide education to help clients stay on track
- Acknowledge that these are issues we all face
By addressing emotional factors, advisors can more effectively help clients’ navigate intricate financial decisions and avoid common behavioral mistakes.

The Top 5 Reasons Clients Fire a Financial Advisor

The Top 5 Reasons Clients Hire a Financial Advisor

Visualizing the Growth of $100, by Asset Class

How Small Investments Make a Big Impact Over Time

What Were the Top Performing Investment Themes of 2023?
-

 Infographics2 years ago
The Top Investment Quotes Every Investor Should Know
-

 Markets in a Minute2 years ago
Mapped: The Growth in U.S. House Prices by State
-

 Markets in a Minute2 years ago
How Closely Related Are Historical Mortgage Rates and Housing Prices?
-

 Infographics2 years ago
A Visual Guide to Stagflation, Inflation, and Deflation
-

 Markets in a Minute1 year ago
Mapped: Global Energy Prices, by Country in 2022
-

 Infographics3 years ago
The 5 Fastest Growing Industries of the Next Decade
-

 Markets in a Minute2 years ago
Visualizing Historical Oil Prices (1968-2022)
-

 Infographics1 year ago
Visual Guide: The Three Types of Economic Indicators
