
Markets in a Minute
Visualizing S&P Performance in 2020, By Sector
This Markets in a Minute Chart is available as a poster.
Visualizing S&P Performance in 2020, By Sector
With 2020 finally over, many are breathing a sigh of relief.
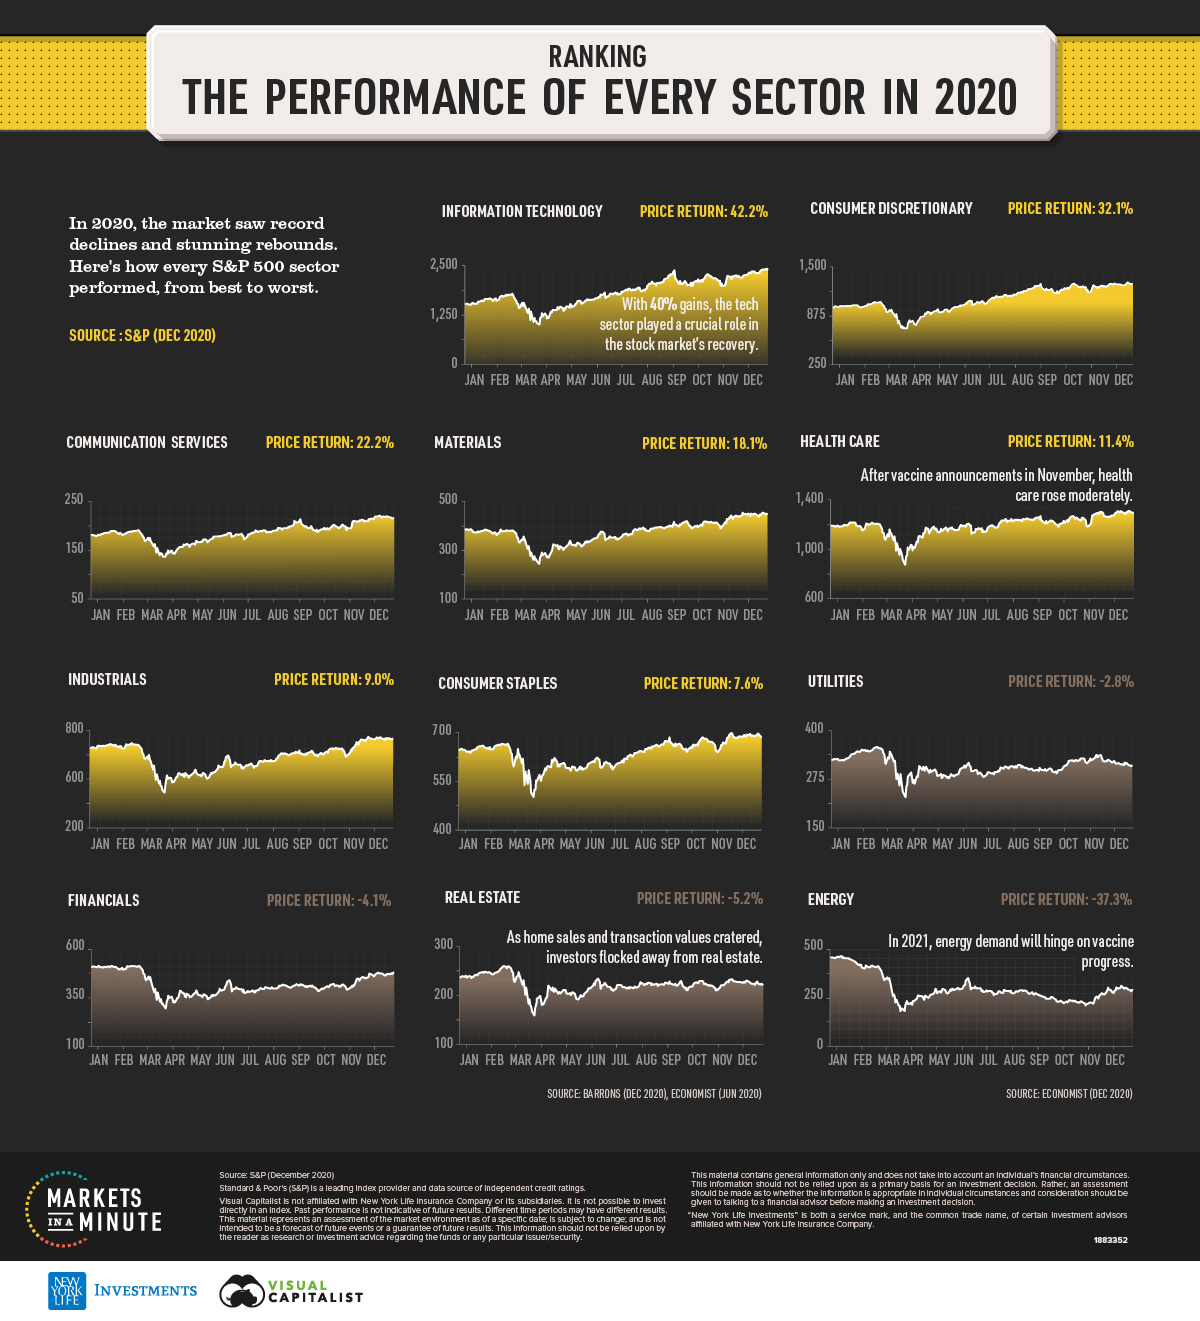
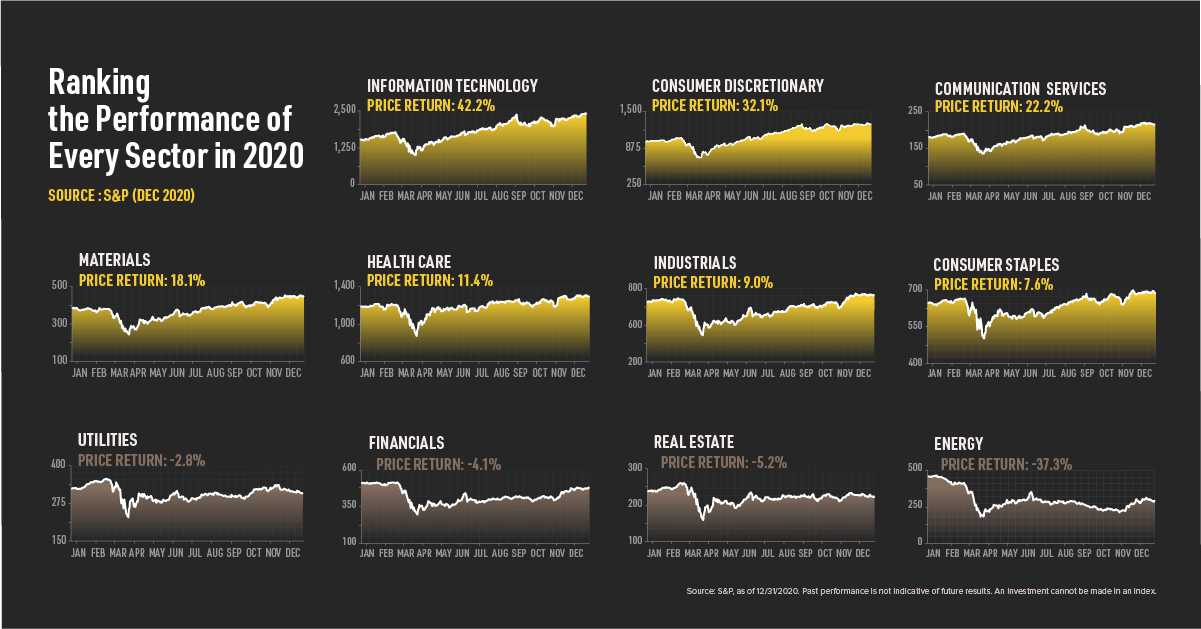
Investors faced a tumultuous year. Still, the S&P 500 finished strong with a 16% gain, outpacing its decade-long average by 4%. Many sectors that provided the new essentials—like online products, communication software and home materials—outperformed the market. It was, of course, a challenging year for other sectors including energy.
This Markets in a Minute graphic from New York Life Investments ranks the 2020 performance of every sector in the S&P 500 using data from S&P Global.
S&P Performance By Sector
As the world coped with devastating losses and uncertainty, how resilient were S&P 500 sectors?
Here’s how every sector performed, from top to bottom.
| S&P 500 Sector | 2020 Price Return | 2019 Price Return | 10-Year Annualized Returns | P/E (Trailing)* |
|---|---|---|---|---|
| Information Technology | 42.2% | 48.0% | 18.9% | 31.6 |
| Consumer Discretionary | 32.1% | 26.2% | 16.0% | 48.1 |
| Communication Services | 22.2% | 30.9% | 5.6% | 27.5 |
| Materials | 18.1% | 21.9% | 6.6% | 40.4 |
| Health Care | 11.4% | 18.7% | 13.8% | 25.3 |
| Industrials | 9.0% | 26.8% | 9.6% | 28.9 |
| Consumer Staples | 7.6% | 24.0% | 8.7% | 25.1 |
| Utilities | -2.8% | 22.2% | 7.2% | 21.1 |
| Financials | -4.1% | 29.2% | 8.6% | 15.3 |
| Real Estate | -5.2% | 24.9% | 6.6% | 36.3 |
| Energy | -37.3% | 7.6% | -5.6% | N/A |
| S&P 500 | 16.3% | 28.9% | 11.6% | 31.2 |
*Trailing P/E measures market value divided by the last 12 months of earnings
As no surprise, technology came out on top with over 42% returns for the year.
COVID-19’s economic impact benefited the sector as activities, from work to socializing, moved online. In 2020, the tech sector’s returns were more than double its 18.9% average over the last decade.
Consumer discretionary was also one of 2020’s top sectors. Home to online marketplace giants along with electric vehicle companies, it posted a 32.1% return—surpassing its 2019 gains.
With -37.3% returns, energy was the hardest hit of all. Historic demand disruptions, along with OPEC tensions led to sector weakness. Like energy, real estate had a difficult year. Still, after declining 40% in March, by year-end, the sector mostly rebounded with just 5% losses.
Why The Market Had a Strong Year
Looking back, one of the biggest questions baffling investors is: why did the market perform so well? A number of factors, including government stimulus, low interest rates, and vaccine expectations can all help explain some of its behavior.
Government Stimulus
In March, the U.S. government approved a $2.2 trillion CARES-Act relief package, breaking historical records for stimulus. This helped create optimism in the market as individuals, small-businesses and corporations received financial relief.
At the same time, the Federal Reserve extended its “quantitative easing” policies that it introduced in 2008. Quantitative easing is when the central bank buys a number of longer-term securities. This type of measure is designed to boost economic activity through injecting liquidity into the market.
In 2020, the Federal Reserve began purchasing corporate bonds and other assets—on top of treasuries and mortgage-backed securities (MBS)—for the first time ever. In fact, the Federal Reserve is now estimated to 34% of MBS in the U.S. to help protect American homeowners.
Low Interest Rates
Another force that may have contributed to S&P performance in 2020 was the Federal Reserve’s low-interest rate policy.
Low interest rates mean that borrowing costs are low, which can be favorable for business conditions. In September, the Federal Reserve announced a “lower for longer policy”, stating that it won’t raise rates until 2023.
Vaccine Expectations
The promise of a vaccine rollout has contributed to S&P 500 performance momentum, along with expectations that things could return to normal in 2021. It also corresponded with double-digit gains for the health care sector.
Though roadblocks and uncertainties remain, vaccine announcements in November also helped spur an uptick in the energy sector, which will be influenced by global vaccine efforts in the months ahead. This, in turn, will help travel resume to normal and spark oil & gas demand.
S&P Performance: What Comes Next in 2021
With the first year of the pandemic behind us, it’s hard to say how the story will continue.
As countries acquire vaccines, there is hope for S&P 500 performance, and future stimulus measures could prop up the stock market. Of course, both the containment of the virus and people feeling safe will have an outsized impact on S&P sectors in the shift to a post-pandemic world.


Markets in a Minute
The Top 5 Reasons Clients Fire a Financial Advisor
Firing an advisor is often driven by more than cost and performance factors. Here are the top reasons clients ‘break up’ with their advisors.

The Top 5 Reasons Clients Fire a Financial Advisor
What drives investors to fire a financial advisor?
From saving for a down payment to planning for retirement, clients turn to advisors to guide them through life’s complex financial decisions. However, many of the key reasons for firing a financial advisor stem from emotional factors, and go beyond purely financial motivations.
We partnered with Morningstar to show the top reasons clients fire an advisor to provide insight on what’s driving investor behavior.
What Drives Firing Decisions?
Here are the top reasons clients terminated their advisor, based on a survey of 184 respondents:
| Reason for Firing | % of Respondents Citing This Reason | Type of Motivation |
|---|---|---|
| Quality of financial advice and services | 32% | Emotion-based reason |
| Quality of relationship | 21% | Emotion-based reason |
| Cost of services | 17% | Financial-based reason |
| Return performance | 11% | Financial-based reason |
| Comfort handling financial issues on their own | 10% | Emotion-based reason |
Numbers may not total 100 due to rounding. Respondents could select more than one answer.
Numbers may not total 100 due to rounding. Respondents could select more than one answer.
While firing an advisor is rare, many of the primary drivers behind firing decisions are also emotionally driven.
Often, advisors were fired due to the quality of the relationship. In many cases, this was due to an advisor not dedicating enough time to fully grasp their personal financial goals. Additionally, wealthier, and more financially literate clients are more likely to fire their advisors—highlighting the importance of understanding the client.
Key Takeaways
Given these driving factors, here are five ways that advisors can build a lasting relationship through recognizing their clients’ emotional needs:
- Understand your clients’ deeper goals
- Reach out proactively
- Act as a financial coach
- Keep clients updated
- Conduct goal-setting exercises on a regular basis
By communicating their value and setting expectations early, advisors can help prevent setbacks in their practice by adeptly recognizing the emotional motivators of their clients.
Markets in a Minute
The Top 5 Reasons Clients Hire a Financial Advisor
Here are the most common drivers for hiring a financial advisor, revealing that investor motivations go beyond just financial factors.

The Top 5 Reasons Clients Hire a Financial Advisor
What drives investors to hire a financial advisor?
From saving for a down payment to planning for retirement, clients turn to advisors to guide them through life’s complex financial decisions. However, many of the key reasons for hiring a financial advisor stem from emotional factors, and go beyond purely financial motivations.
We partnered with Morningstar to show the top reasons clients hire a financial advisor to provide insight on what’s driving investor behavior.
What Drives Hiring Decisions?
Here are the most common reasons for hiring an advisor, based on a survey of 312 respondents.
| Reason for Hiring | % of Respondents Citing This Reason | Type of Motivation |
|---|---|---|
| Specific goals or needs | 32% | Financial-based reason |
| Discomfort handling finances | 32% | Emotion-based reason |
| Behavioral coaching | 17% | Emotion-based reason |
| Recommended by family or friends | 12% | Emotion-based reason |
| Quality of relationship | 10% | Emotion-based reason |
Numbers may not total 100 due to rounding. Respondents could select more than one answer.
While financial factors played an important role in hiring decisions, emotional reasons made up the largest share of total responses.
This illustrates that clients place a high degree of importance on reaching specific goals or needs, and how an advisor communicates with them. Furthermore, clients seek out advisors for behavioral coaching to help them make informed decisions while staying the course.
Key Takeaways
With this in mind, here are five ways advisors can provide value to their clients and grow their practice:
- Address clients’ emotional needs early on
- Demonstrate how you can offer support
- Use ordinary language
- Provide education to help clients stay on track
- Acknowledge that these are issues we all face
By addressing emotional factors, advisors can more effectively help clients’ navigate intricate financial decisions and avoid common behavioral mistakes.

The Top 5 Reasons Clients Fire a Financial Advisor

The Top 5 Reasons Clients Hire a Financial Advisor

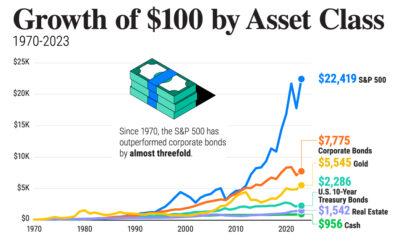
Visualizing the Growth of $100, by Asset Class

How Small Investments Make a Big Impact Over Time

What Were the Top Performing Investment Themes of 2023?
-

 Infographics2 years ago
The Top Investment Quotes Every Investor Should Know
-

 Markets in a Minute2 years ago
Mapped: The Growth in U.S. House Prices by State
-

 Markets in a Minute2 years ago
How Closely Related Are Historical Mortgage Rates and Housing Prices?
-

 Infographics2 years ago
A Visual Guide to Stagflation, Inflation, and Deflation
-

 Markets in a Minute1 year ago
Mapped: Global Energy Prices, by Country in 2022
-

 Markets in a Minute2 years ago
Visualizing Historical Oil Prices (1968-2022)
-

 Infographics1 year ago
Visual Guide: The Three Types of Economic Indicators
-

 Markets in a Minute2 years ago
Mapped: Global Macroeconomic Risk, by Country in 2022
