
Infographics
A History of Revolution in U.S. Taxation
As Benjamin Franklin once said, “Nothing is certain except death and taxes.”
While this quote was penned in 1789, his words still ring true today. U.S. taxation has changed over time, but it has always existed in some shape or form for over 250 years.
U.S. Taxation: 1765 to Today
In today’s infographic from New York Life Investments, we explore the history of U.S. taxation – from its colonial roots to its recent reform.

The modern American tax code has little resemblance to its early iterations.
Over the last few centuries, Americans have battled against British taxation, faced sky-high tax rates to fund war efforts, and enjoyed tax cuts designed to boost economic growth.
A Timeline of U.S. Taxation
Today, total U.S. tax revenue exceeds $3.4 trillion. Below are some notable events that have shaped modern American taxation.
Colonial Roots: 1765 to 1783
1765 – Stamp Act
In its first direct tax on the colonists, Britain places a tax on all paper – including ship’s papers, court documents, advertisements, and even playing cards.
1767 – Townshend Revenue Act
Importation duties are placed on British products such as glass, paint, and tea. The taxes are expected to raise £40,000 annually, (£6,500,000 in 2018 GBP). As hostilities continue to bubble up, colonists argue for “No taxation without representation”. Although taxes are imposed on the colonists, they aren’t able to elect representatives to British parliament.
1770 – The Boston Massacre
British troops occupy Boston to end the boycott on British goods. The March 5th Boston Massacre sees five colonists killed. By April, all Townshend duties are repealed except for the one on tea.
1773 – The Tea Act (May 10)
Britain grants the struggling British East India Company a monopoly on tea in America. While no new taxes are imposed, this angers colonists as it is seen as a thinly veiled plan to gain colonial support for the Townshend tax while threatening local business.
1773 – The Boston Tea Party (December 16)
Three ships arrive in Boston carrying British East India Company tea. Colonists refuse to allow the unloading of the tea, throwing all 342 chests of tea into Boston Harbour.
1775-1783 – The American Revolutionary War
Growing tensions between Britain and the colonists erupt in a full-scale war. After eight long years, Britain officially recognizes the independence of the United States.
A Free Nation: 1787 to 1943
1787 – The U.S. Constitution
Congress gains the “power to lay and collect taxes, duties, imposts, and excises.” The government primarily earns revenue from excise taxes and tariffs, including an “importation tax” on slaves.
1791-1794 – Whiskey Rebellion
Alexander Hamilton, the nation’s first Secretary of Treasury, leads the implementation of a whiskey excise tax. In 1794, whiskey rebels destroy a tax inspector’s home. President Washington sends in troops and quells the rebellion.
1862 – The Nation’s First Income Tax
To help pay for the Civil War, President Lincoln legislates the nation’s first income tax.
| Income level (1862 dollars) | Income level (2019 dollars) | Tax Rate |
|---|---|---|
| $600-$10,000 | $15,000-$250,000 | 3% |
| $10,000+ | $250,000+ | 5% |
1913 – 16th Amendment
As World War I looms the 16th amendment is ratified, allowing for taxation without allocation according to state populations. An income tax is permanently introduced for both individuals and corporations, and the first Form 1040 is created.
| Income Level (1913 dollars) | Income level (2019 dollars) | Tax Rate |
|---|---|---|
| $3,000+ | $77,000+ | 1% |
| $500,000+ | $12,800,000+ | 7% |
1918 – The Revenue Act
Tax rates skyrocket to pay for World War I efforts. The top tax rate is 77%.
1935 – Social Security Act
In light of the Great Depression, the Social Security Act introduces:
- An old-age pension program
- Unemployment insurance
- Funding for health and welfare programs
To fund the programs, a 2% tax is shared equally by an employee and their employer.
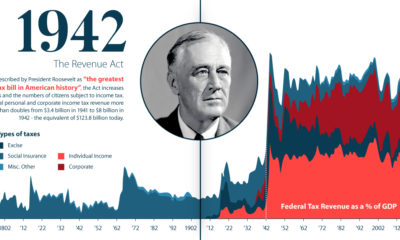
1942 – The Revenue Act
Described by President Roosevelt as “the greatest tax bill in American history”, the Act increases taxes and the numbers of citizens subject to income tax. Total personal and corporate income tax revenue more than doubles:
| Year | Revenue | 2019 dollar equivalent |
|---|---|---|
| 1941 | $3.4 billion | $59.2 billion |
| 1942 | $8.0 billion | $123.8 billion |
1943 – Current Tax Payment Act
It becomes mandatory for employers to withhold taxes from employees’ wages and remit them four times per year.
Modern Times: 1961 to 2018
1961 – Beginning of The Computer Age
The National Computer Center at Martinsburg, West Virginia is formally dedicated to assisting the IRS in its shift to computer data processing.
1986 – Tax Reform Act
The Tax Reform Act:
- Lowers the top individual tax rate from 50% to 28%
- Increases taxes on capital gains from 20% to 28%
- Reduces corporate tax breaks
The revisions are designed to make the tax code simpler and fairer.
1992 – Electronic Filing
Taxpayers who owe money are given the option to file electronically.
2001 – Economic Growth and Tax Relief Reconciliation Act
President George W. Bush implements large tax cuts:
- Creates a new lowest individual tax rate of 10%
- Reduces the top individual tax rate from 39.6% to 35%
- Doubles child tax credit from $500 to $1,000* (*From $700 to $1,400 in 2019 dollars)
2017 – Tax Cuts and Jobs Act
President Trump signs off on reductions in tax rates, while some deductions are made more restrictive.
For example, State and Local Taxes (SALT) deductions are capped at $10,000. Residents in high-tax states such as New York, New Jersey, California and Connecticut could see substantially higher tax bills.
The Future
U.S. taxation policy remains a contentious issue and shifts depending on who is in the White House.
Investors need to stay informed on current legislation, so they can engage in proactive financial planning and minimize their tax obligations.


Infographics
The 20 Most Common Investment Mistakes, in One Chart
Here are the top investment mistakes to avoid, from emotionally driven investing to paying too much in fees.
The 20 Most Common Investment Mistakes
No one is immune to errors, including the best investors in the world.
Fortunately, investment mistakes can provide valuable lessons over time, providing investors an opportunity to gain insights on investing—and build more resilient portfolios.
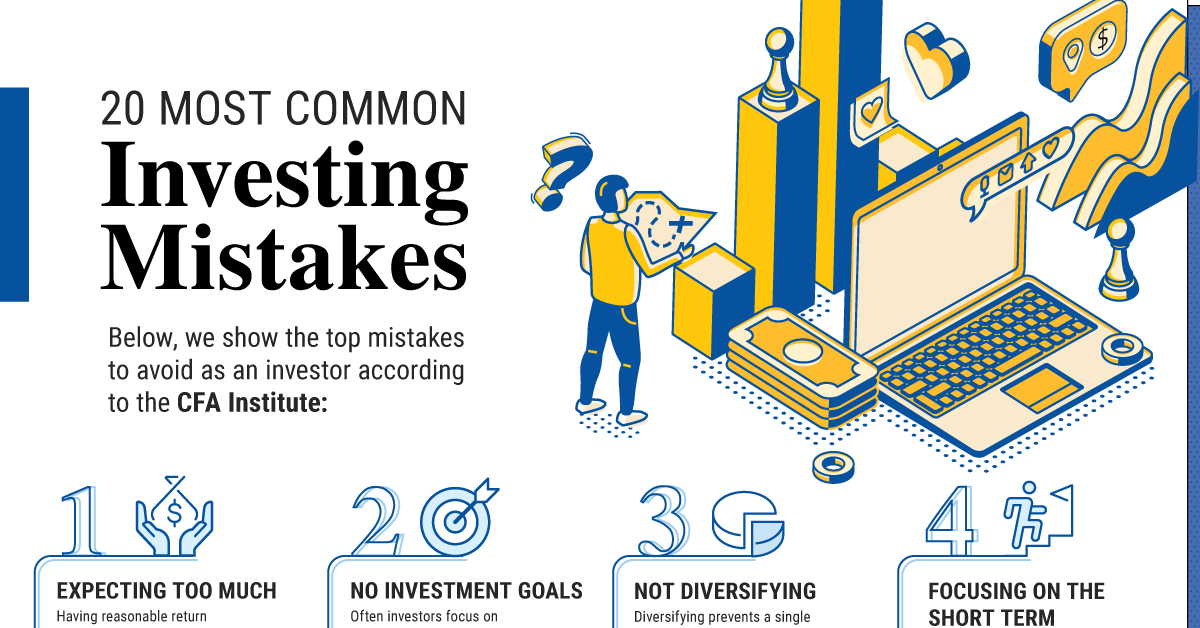
This graphic shows the top 20 mistakes to watch out for, according to the CFA Institute.
20 Investment Mistakes to Avoid
From emotionally driven investment decisions to paying too much on fees, here are some mistakes that investors commonly make:
| Top 20 Mistakes | Description |
|---|---|
| 1. Expecting Too Much | Having reasonable return expectations helps investors keep a long-term view without reacting emotionally. |
| 2. No Investment Goals | Often investors focus on short-term returns or the latest investment craze instead of their long-term investment goals. |
| 3. Not Diversifying | Diversifying prevents a single stock from drastically impacting the value of your portfolio. |
| 4. Focusing on the Short Term | It’s easy to focus on the short term, but this can make investors second-guess their original strategy and make careless decisions. |
| 5. Buying High and Selling Low | Investor behavior during market swings often hinders overall performance. |
| 6. Trading Too Much | One study shows that the most active traders underperformed the U.S. stock market by 6.5% on average annually. Source: The Journal of Finance |
| 7. Paying Too Much in Fees | Fees can meaningfully impact your overall investment performance, especially over the long run. |
| 8. Focusing Too Much on Taxes | While tax-loss harvesting can boost returns, making a decision solely based on its tax consequences may not always be merited. |
| 9. Not Reviewing Investments Regularly | Review your portfolio quarterly or annually to make sure you’re staying on track or if your portfolio is in need of rebalancing. |
| 10. Misunderstanding Risk | Too much risk can take you out of your comfort zone, but too little risk may result in lower returns that do not reach your financial goals. Recognize the right balance for your personal situation. |
| 11. Not Knowing Your Performance | Often, investors don’t actually know the performance of their investments. Review your returns to track if you are meeting your investment goals factoring in fees and inflation. |
| 12. Reacting to the Media | Negative news in the short-term can trigger fear, but remember to focus on the long run. |
| 13. Forgetting About Inflation | Historically, inflation has averaged 4% annually. Value of $100 at 4% Annual Inflation After 1 Year: $96 After 20 Years: $44 |
| 14. Trying to Time the Market | Market timing is extremely hard. Staying in the market can generate much higher returns versus trying to time the market perfectly. |
| 15. Not Doing Due Diligence | Check the credentials of your advisor through sites like BrokerCheck, which shows their employment history and complaints. |
| 16. Working With the Wrong Advisor | Taking the time to find the right advisor is worth it. Vet your advisor carefully to ensure your goals are aligned. |
| 17. Investing With Emotions | Although it can be challenging, remember to stay rational during market fluctuations. |
| 18. Chasing Yield | High-yielding investments often carry the highest risk. Carefully assess your risk profile before investing in these types of assets. |
| 19. Neglecting to Start | Consider two people investing $200 monthly assuming a 7% annual rate of return until the age of 65. If one person started at age 25, their end portfolio would be $520K, but if the other started at 35 it would total about $245K. |
| 20. Not Controlling What You Can | While no one can predict the market, investors can control small contributions over time, which can have powerful outcomes. |
For instance, not properly diversifying can expose you to higher risk. Holding one concentrated position can drastically impact the value of your portfolio when prices fluctuate.
In fact, one study shows that the optimal diversification for a large-cap portfolio is holding 15 stocks. In this way, it helps capture the highest possible return relative to risk. When it came to a small-cap portfolio, the number of stocks rose to 26 for optimal risk reduction.
It’s worth noting that one size does not fit all, and seeking financial advice can help you find the right balance based on your financial goals.
Another common mistake is trading too much. Since each trade can rake up fees, this can impact your overall portfolio performance. A separate study showed that the most active traders saw the worst returns, underperforming the U.S. stock market by 6.5% on average annually.
Finally, it’s important to carefully monitor your investments regularly as market conditions change, factoring in fees and inflation. This will let you know if your investments are on track, or if you need to adjust based on changing personal circumstances or other factors.
Controlling What You Can
To help avoid these mistakes, investors can remember to stay rational and focus on their long-term goals. Building a solid portfolio often involves assessing the following factors:
- Financial goals
- Current income
- Spending habits
- Market environment
- Expected returns
With these factors in mind, investors can avoid focusing on short-term market swings, and control what they can. Making small investments over the long run can have powerful effects, with the potential to accumulate significant wealth simply by investing consistently over time.

Infographics
Visual Guide: The Three Types of Economic Indicators
From GDP to interest rates, this infographic shows key economic indicators for navigating the massive U.S. economy.
View the high resolution version of this infographic. Buy the poster.
A Visual Guide to Economic Indicators
Economic indicators provide insight on the state of financial markets.
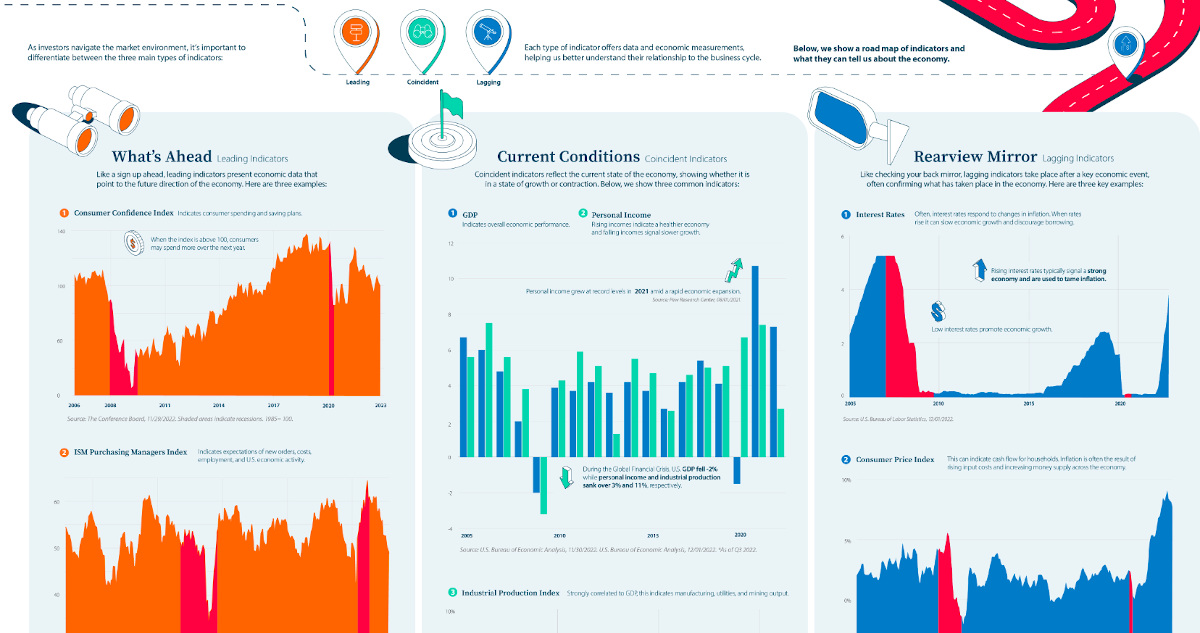
Each type of indicator offers data and economic measurements, helping us better understand their relationship to the business cycle. As investors navigate the market environment, it’s important to differentiate between the three main types of indicators:
- Leading
- Coincident
- Lagging
The above infographic from New York Life Investments shows a road map of indicators and what they can tell us about the economy.
What’s Ahead: Leading Indicators
Leading indicators present economic data that point to the future direction of the economy like a sign up ahead. Here are three examples.
1. Consumer Confidence Index
This key measure indicates consumer spending and saving plans. When the index is above 100, consumers may spend more over the next year. In December, the index jumped to 108 up from 101 in November. This was in part due to lower inflation expectations and improving job prospects.
In the December survey, 48% indicated that the job market remained strong, highlighting the strength of employment opportunities and likely influencing sentiment towards spending in the future.
2. ISM Purchasing Managers Index
The ISM Purchasing Managers Index indicates expectations of new orders, costs, employment, and U.S. economic activity in the manufacturing sector. The following table shows how the index is broken down based on select measures:
| Index | Nov 2022 | Oct 2022 | Percentage Point Change | Direction | Trend (Months) |
|---|---|---|---|---|---|
| Manufacturing PMI | 49.0 | 50.2 | -1.2 | Contracting | 1 |
| New Orders | 47.2 | 49.2 | -2.0 | Contracting | 3 |
| Employment | 48.4 | 50.0 | -1.6 | Contracting | 1 |
| Prices | 43.0 | 46.6 | -3.6 | Decreasing | 2 |
| Imports | 46.6 | 50.8 | -4.2 | Contracting | 1 |
| Manufacturing Sector | Contracting | 1 |
For instance, in November the index fell into its first month of contraction since May 2020. Falling new orders signal that demand has weakened while contracting employment figures indicate lower output across the sector.
3. S&P 500 Index
The S&P 500 Index indicates the economy’s direction since forward-looking performance is factored into prices. In this way, the S&P 500 Index can represent investor confidence as the index often serves as a proxy for U.S. equity markets. In 2022, returns for the index are roughly -20% year-to-date.
Current Conditions: Coincident Indicators
Coincident indicators reflect the current state of the economy, showing whether it is in a state of growth or contraction.
1. GDP
GDP indicates overall economic performance. Typically it serves as the most comprehensive gauge of the economy since it tracks output across all sectors. In the third quarter of 2022, real U.S. GDP increased 2.9% on an annual basis. That compares to 2.7% for the same period in 2021.
2. Personal Income
Rising incomes indicate a healthier economy and falling incomes signal slower growth. Personal income grew at record levels in 2021 to 7.4% annually amid a rapid economic expansion.
This year, U.S. personal income has grown at a slower pace, at 2.7% on an annual basis as of the third quarter.
3. Industrial Production Index
Strongly correlated to GDP, the industrial production index indicates manufacturing, utilities, and mining output. Below, we show trends in industrial production and how they correspond with GDP and personal income indicators.
| Date | U.S. GDP | Personal Income | Industrial Production |
|---|---|---|---|
| 2022* | 7.3% | 2.7% | 4.7% |
| 2021 | 10.7% | 7.4% | 4.9% |
| 2020 | -1.5% | 6.7% | -7.0% |
| 2019 | 4.1% | 5.1% | -0.7% |
| 2018 | 5.4% | 5.0% | 3.2% |
| 2017 | 4.2% | 4.6% | 1.4% |
| 2016 | 2.7% | 2.6% | -2.0% |
| 2015 | 3.7% | 4.7% | -1.4% |
| 2014 | 4.2% | 5.5% | 3.0% |
| 2013 | 3.6% | 1.3% | 2.0% |
| 2012 | 4.2% | 5.1% | 3.0% |
| 2011 | 3.7% | 5.9% | 3.2% |
| 2010 | 3.9% | 4.3% | 5.5% |
| 2009 | -2.0% | -3.2% | -11.4% |
| 2008 | 2.0% | 3.8% | -3.5% |
| 2007 | 4.8% | 5.6% | 2.5% |
| 2006 | 6.0% | 7.5% | 2.3% |
| 2005 | 6.7% | 5.6% | 3.3% |
*As of Q3 2022.
As the above table shows, factory production collapsed following the 2008 financial crisis, a key indicator for the depth of an economic downturn. Meanwhile, personal income sank over -3% while GDP fell -2%.
Despite economic uncertainty in 2022, industrial production remains positive, at a 4.7% growth rate, albeit somewhat slower than 2021 levels.
Rearview Mirror: Lagging Indicators
Like checking your back mirror, lagging indicators take place after a key economic event, often confirming what has taken place in the economy. Here are three key examples.
1. Interest Rates
Often, interest rates respond to changes in inflation. When rates rise it can slow economic growth and discourage borrowing. Rising interest rates typically signal a strong economy and are used to tame inflation. On the other hand, low interest rates promote economic growth.
Following years of record-low interest rates, the Federal Funds rate increased at the fastest rate in decades over 2022, jumping from 0.25% in March to 4.25% in December as inflation accelerated.
2. Consumer Price Index
This inflation measure can indicate cash flow for households. Inflation is often the result of rising input costs and increasing money supply across the economy.
Sometimes, inflation can reach a peak after an expansion has ended as rising demand in an economy has pushed up prices. In November, U.S. inflation reached 7.1% annually amid supply chain disruptions and price pressures across food prices, medical prices, and housing costs.
| Year | Inflation Rate | Annual Change |
|---|---|---|
| 2022* | 7.1% | 2.4% |
| 2021 | 4.7% | 3.5% |
| 2020 | 1.2% | -0.6% |
| 2019 | 1.8% | -0.6% |
| 2018 | 2.4% | 0.3% |
| 2017 | 2.1% | 0.9% |
| 2016 | 1.3% | 1.1% |
| 2015 | 0.1% | -1.5% |
| 2014 | 1.6% | 0.2% |
| 2013 | 1.5% | -0.6% |
| 2012 | 2.1% | -1.1% |
| 2011 | 3.2% | 1.5% |
| 2010 | 1.6% | 2.0% |
| 2009 | -0.4% | -4.2% |
| 2008 | 3.8% | 1.0% |
| 2007 | 2.9% | -0.4% |
| 2006 | 3.2% | -0.2% |
| 2005 | 3.4% | 0.7% |
*As of November 2022.
3. Unemployment Rate
The unemployment rate has many spillover effects, impacting consumer spending and in turn retail sales and GDP. Historically, unemployment falls slowly after an economic recovery which is why it’s considered a lagging indicator. When the unemployment rate rises it confirms lagging economic performance.
Overall, 2022 has been characterized by a strong job market, with unemployment levels below historical averages, at 3.7% as of October.
On the Road
To get a more comprehensive picture of the economy, combining a number of indicators is more effective than isolating a few variables. With these tools, investors can gain more perspective on the cyclical nature of the business cycle while keeping a long-term perspective in mind on the road ahead.

The Top 5 Reasons Clients Fire a Financial Advisor

The Top 5 Reasons Clients Hire a Financial Advisor

Visualizing the Growth of $100, by Asset Class

How Small Investments Make a Big Impact Over Time

What Were the Top Performing Investment Themes of 2023?
-

 Infographics2 years ago
The Top Investment Quotes Every Investor Should Know
-

 Markets in a Minute2 years ago
Mapped: The Growth in U.S. House Prices by State
-

 Markets in a Minute2 years ago
How Closely Related Are Historical Mortgage Rates and Housing Prices?
-

 Infographics2 years ago
A Visual Guide to Stagflation, Inflation, and Deflation
-

 Markets in a Minute1 year ago
Mapped: Global Energy Prices, by Country in 2022
-

 Infographics3 years ago
The 5 Fastest Growing Industries of the Next Decade
-

 Markets in a Minute2 years ago
Visualizing Historical Oil Prices (1968-2022)
-

 Infographics1 year ago
Visual Guide: The Three Types of Economic Indicators
