
Markets in a Minute
Animated Map: An Economic Forecast for the COVID-19 Recovery (2020-21)
This Markets in a Minute Chart is available as a poster.
This Markets in a Minute Chart is available as a poster.
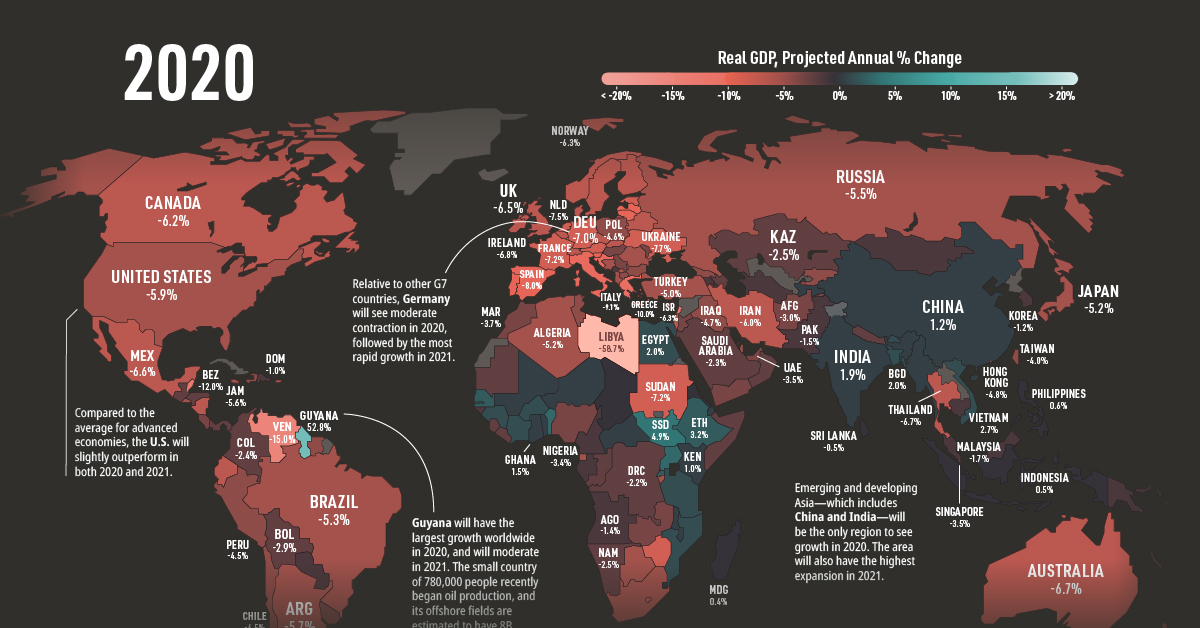
COVID-19 Recovery: A Global Economic Forecast
As governments enact COVID-19 containment measures, economies around the world have slowed to a crawl. Many people find themselves out of work, and businesses are struggling to stay afloat amid strict regulations and plummeting demand.
However, while current economic conditions are bleak, some forecasts for the upcoming recovery provide room for investor optimism. According to the most recent forecast from the International Monetary Fund (IMF), it’s projected that the global economy will contract by 3% in 2020, followed by 5.8% growth in 2021.
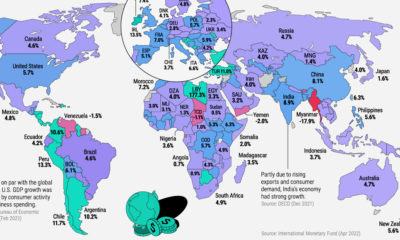
In today’s Markets in a Minute from New York Life Investments, we take a look at the country-level economic forecast to highlight which areas may recover the fastest.
Emerging from The Great Lockdown
Given the numerous uncertainties COVID-19 brings, preparing an economic forecast was no easy task. The IMF’s most recent projections assume that the pandemic fades in the second half of 2020, containment efforts are gradually unwound, and governments provide policy support.
With this in mind, which countries are expected to see the strongest recoveries? Below is the full country-level forecast, sorted by projected real GDP growth in 2021.
Real GDP, Annual Percentage Change
2019 Actual, 2020-2021 Projected
| Jurisdiction | 2019 | 2020P | 2021P |
|---|---|---|---|
| Libya | 9.9 | –58.7 | 80.7 |
| Macao SAR | –4.7 | –29.6 | 32.0 |
| Palau | 0.5 | –11.9 | 14.4 |
| Maldives | 5.7 | –8.1 | 13.2 |
| Aruba | 0.4 | –13.7 | 12.1 |
| Bangladesh | 7.9 | 2.0 | 9.5 |
| China | 6.1 | 1.2 | 9.2 |
| Malaysia | 4.3 | –1.7 | 9.0 |
| Côte d'Ivoire | 6.9 | 2.7 | 8.7 |
| St. Kitts and Nevis | 2.9 | –8.1 | 8.5 |
| Djibouti | 7.5 | 1.0 | 8.5 |
| Latvia | 2.2 | –8.6 | 8.3 |
| Lithuania | 3.9 | –8.1 | 8.2 |
| Indonesia | 5.0 | 0.5 | 8.2 |
| Niger | 5.8 | 1.0 | 8.1 |
| Mongolia | 5.1 | –1.0 | 8.0 |
| Albania | 2.2 | –5.0 | 8.0 |
| Antigua and Barbuda | 5.3 | –10.0 | 8.0 |
| Kyrgyz Republic | 4.5 | –4.0 | 8.0 |
| Seychelles | 3.9 | –10.8 | 8.0 |
| Estonia | 4.3 | –7.5 | 7.9 |
| Philippines | 5.9 | 0.6 | 7.6 |
| Belize | 0.3 | –12.0 | 7.6 |
| Guinea | 5.6 | 2.9 | 7.6 |
| Czech Republic | 2.6 | –6.5 | 7.5 |
| Myanmar | 6.5 | 1.8 | 7.5 |
| Kosovo | 4.0 | –5.0 | 7.5 |
| Serbia | 4.2 | –3.0 | 7.5 |
| India | 4.2 | 1.9 | 7.4 |
| Iraq | 3.9 | –4.7 | 7.2 |
| Barbados | –0.1 | –7.6 | 7.1 |
| Malta | 4.4 | –2.8 | 7.0 |
| Fiji | 0.5 | –5.8 | 7.0 |
| Vietnam | 7.0 | 2.7 | 7.0 |
| North Macedonia | 3.6 | –4.0 | 7.0 |
| Uzbekistan | 5.6 | 1.8 | 7.0 |
| St. Lucia | 1.7 | –8.5 | 6.9 |
| Botswana | 3.0 | –5.4 | 6.8 |
| The Bahamas | 1.8 | –8.3 | 6.7 |
| Rwanda | 10.1 | 3.5 | 6.7 |
| Montenegro | 3.6 | –9.0 | 6.5 |
| The Gambia | 6.0 | 2.5 | 6.5 |
| Turkmenistan | 6.3 | 1.8 | 6.4 |
| Ireland | 5.5 | –6.8 | 6.3 |
| Guyana | 4.7 | 52.8 | 6.3 |
| Algeria | 0.7 | –5.2 | 6.2 |
| Australia | 1.8 | –6.7 | 6.1 |
| Cambodia | 7.0 | –1.6 | 6.1 |
| Thailand | 2.4 | –6.7 | 6.1 |
| Grenada | 3.1 | –8.0 | 6.1 |
| Yemen | 2.1 | –3.0 | 6.1 |
| Chad | 3.0 | –0.2 | 6.1 |
| Kenya | 5.6 | 1.0 | 6.1 |
| Denmark | 2.4 | –6.5 | 6.0 |
| Iceland | 1.9 | –7.2 | 6.0 |
| Bulgaria | 3.4 | –4.0 | 6.0 |
| Benin | 6.4 | 4.5 | 6.0 |
| New Zealand | 2.2 | –7.2 | 5.9 |
| Eritrea | 3.8 | 0.1 | 5.9 |
| Ghana | 6.1 | 1.5 | 5.9 |
| Mauritius | 3.5 | –6.8 | 5.9 |
| Burkina Faso | 5.7 | 2.0 | 5.8 |
| Cyprus | 3.2 | –6.5 | 5.6 |
| Lao P.D.R. | 4.7 | 0.7 | 5.6 |
| Guatemala | 3.6 | –2.0 | 5.5 |
| Tajikistan | 7.5 | 1.0 | 5.5 |
| Cabo Verde | 5.5 | –4.0 | 5.5 |
| São Tomé and Príncipe | 1.3 | –6.0 | 5.5 |
| Senegal | 5.3 | 3.0 | 5.5 |
| Slovenia | 2.4 | –8.0 | 5.4 |
| San Marino | 1.1 | –12.2 | 5.4 |
| St. Vincent and the Grenadines | 0.4 | –4.5 | 5.4 |
| Chile | 1.1 | –4.5 | 5.3 |
| Germany | 0.6 | –7.0 | 5.2 |
| Sweden | 1.2 | –6.8 | 5.2 |
| Peru | 2.2 | –4.5 | 5.2 |
| Greece | 1.9 | –10.0 | 5.1 |
| Lesotho | 1.2 | –5.2 | 5.1 |
| Portugal | 2.2 | –8.0 | 5.0 |
| Slovak Republic | 2.3 | –6.2 | 5.0 |
| Israel | 3.5 | –6.3 | 5.0 |
| Nepal | 7.1 | 2.5 | 5.0 |
| Turkey | 0.9 | –5.0 | 5.0 |
| Uruguay | 0.2 | –3.0 | 5.0 |
| Qatar | 0.1 | –4.3 | 5.0 |
| Madagascar | 4.8 | 0.4 | 5.0 |
| Vanuatu | 2.9 | –3.3 | 4.9 |
| Croatia | 2.9 | –9.0 | 4.9 |
| Suriname | 2.3 | –4.9 | 4.9 |
| Italy | 0.3 | –9.1 | 4.8 |
| Luxembourg | 2.3 | –4.9 | 4.8 |
| Armenia | 7.6 | –1.5 | 4.8 |
| Morocco | 2.2 | –3.7 | 4.8 |
| United States | 2.3 | –5.9 | 4.7 |
| Mozambique | 2.2 | 2.2 | 4.7 |
| Belgium | 1.4 | –6.9 | 4.6 |
| Tanzania | 6.3 | 2.0 | 4.6 |
| France | 1.3 | –7.2 | 4.5 |
| Austria | 1.6 | –7.0 | 4.5 |
| El Salvador | 2.4 | –5.4 | 4.5 |
| Afghanistan | 3.0 | –3.0 | 4.5 |
| Argentina | –2.2 | –5.7 | 4.4 |
| Spain | 2.0 | –8.0 | 4.3 |
| Ethiopia | 9.0 | 3.2 | 4.3 |
| Uganda | 4.9 | 3.5 | 4.3 |
| Canada | 1.6 | –6.2 | 4.2 |
| Sri Lanka | 2.3 | –0.5 | 4.2 |
| Hungary | 4.9 | –3.1 | 4.2 |
| Poland | 4.1 | –4.6 | 4.2 |
| Mauritania | 5.9 | –2.0 | 4.2 |
| Burundi | 1.8 | –5.5 | 4.2 |
| Moldova | 3.6 | –3.0 | 4.1 |
| Honduras | 2.7 | –2.4 | 4.1 |
| Kazakhstan | 4.5 | –2.5 | 4.1 |
| Tunisia | 1.0 | –4.3 | 4.1 |
| Cameroon | 3.7 | –1.2 | 4.1 |
| Mali | 5.1 | 1.5 | 4.1 |
| United Kingdom | 1.4 | –6.5 | 4.0 |
| Dominican Republic | 5.1 | –1.0 | 4.0 |
| Panama | 3.0 | –2.0 | 4.0 |
| Paraguay | 0.2 | –1.0 | 4.0 |
| Central African Republic | 3.0 | 1.0 | 4.0 |
| Liberia | –2.5 | –2.5 | 4.0 |
| Sierra Leone | 5.1 | –2.3 | 4.0 |
| South Africa | 0.2 | –5.8 | 4.0 |
| Togo | 5.3 | 1.0 | 4.0 |
| Hong Kong SAR | –1.2 | –4.8 | 3.9 |
| Romania | 4.1 | –5.0 | 3.9 |
| Ecuador | 0.1 | –6.3 | 3.9 |
| Switzerland | 0.9 | –6.0 | 3.8 |
| Solomon Islands | 1.2 | –2.1 | 3.8 |
| Timor-Leste | 3.1 | –3.0 | 3.8 |
| Colombia | 3.3 | –2.4 | 3.7 |
| Jordan | 2.0 | –3.7 | 3.7 |
| Ukraine | 3.2 | –7.7 | 3.6 |
| Gabon | 3.4 | –1.2 | 3.6 |
| Taiwan Province of China | 2.7 | –4.0 | 3.5 |
| Brunei Darussalam | 3.9 | 1.3 | 3.5 |
| Tuvalu | 6.0 | –1.0 | 3.5 |
| Belarus | 1.2 | –6.0 | 3.5 |
| Bosnia and Herzegovina | 2.7 | –5.0 | 3.5 |
| Russia | 1.3 | –5.5 | 3.5 |
| Jamaica | 1.0 | –5.6 | 3.5 |
| Democratic Republic of the Congo | 4.4 | –2.2 | 3.5 |
| Korea | 2.0 | –1.2 | 3.4 |
| Dominica | 9.2 | –4.7 | 3.4 |
| Kuwait | 0.7 | –1.1 | 3.4 |
| Republic of Congo | –0.9 | –2.3 | 3.4 |
| United Arab Emirates | 1.3 | –3.5 | 3.3 |
| Marshall Islands | 2.4 | –0.2 | 3.2 |
| Namibia | –1.4 | –2.5 | 3.2 |
| South Sudan | 11.3 | 4.9 | 3.2 |
| Finland | 1.0 | –6.0 | 3.1 |
| Iran | –7.6 | –6.0 | 3.1 |
| Comoros | 1.9 | –1.2 | 3.1 |
| Netherlands | 1.8 | –7.5 | 3.0 |
| Japan | 0.7 | –5.2 | 3.0 |
| Singapore | 0.7 | –3.5 | 3.0 |
| Costa Rica | 2.1 | –3.3 | 3.0 |
| Mexico | –0.1 | –6.6 | 3.0 |
| Bahrain | 1.8 | –3.6 | 3.0 |
| Georgia | 5.1 | –4.0 | 3.0 |
| Oman | 0.5 | –2.8 | 3.0 |
| Guinea-Bissau | 4.6 | –1.5 | 3.0 |
| Norway | 1.2 | –6.3 | 2.9 |
| Bhutan | 5.3 | 2.7 | 2.9 |
| Papua New Guinea | 5.0 | –1.0 | 2.9 |
| Bolivia | 2.8 | –2.9 | 2.9 |
| Brazil | 1.1 | –5.3 | 2.9 |
| Saudi Arabia | 0.3 | –2.3 | 2.9 |
| Somalia | 2.9 | –2.5 | 2.9 |
| Egypt | 5.6 | 2.0 | 2.8 |
| Trinidad and Tobago | –0.0 | –4.5 | 2.6 |
| Angola | –1.5 | –1.4 | 2.6 |
| Malawi | 4.5 | 1.0 | 2.5 |
| Zimbabwe | –8.3 | –7.4 | 2.5 |
| Nigeria | 2.2 | –3.4 | 2.4 |
| Equatorial Guinea | –6.1 | –5.5 | 2.3 |
| Zambia | 1.5 | –3.5 | 2.3 |
| Kiribati | 2.3 | 0.0 | 2.2 |
| Pakistan | 3.3 | –1.5 | 2.0 |
| Eswatini | 1.0 | –0.9 | 1.8 |
| Puerto Rico | 2.0 | –6.0 | 1.5 |
| Micronesia | 1.2 | –0.4 | 1.4 |
| Nauru | 1.0 | –1.7 | 1.3 |
| Tonga | –0.1 | –1.2 | 1.2 |
| Haiti | –1.2 | –4.0 | 1.2 |
| Azerbaijan | 2.3 | –2.2 | 0.7 |
| Samoa | 3.5 | –3.7 | 0.5 |
| Nicaragua | –3.9 | –6.0 | 0.0 |
| Sudan | –2.5 | –7.2 | –3.0 |
| Venezuela | –35.0 | –15.0 | –5.0 |
| Lebanon | –6.5 | –12.0 | No data |
| Syria | No data | No data | No data |
Libya is forecast to have the highest growth in 2021, as well as the deepest contraction in 2020. However, the IMF notes the reliability of this data is low given Libya is currently facing a civil war and weak capacity.
Emerging and developing Asia is expected to have a strong recovery, with China and India predicted to see 2021 growth rates of 9.2% and 7.4% respectively. For China, this is a welcome change after its first quarter GDP contracted by 6.8%, the first decline since at least 1992.
The IMF predicts the U.S. will see GDP growth of 4.7% in 2021, which is slightly higher than the 4.5% average for advanced economies. Separately, the U.S. Federal Reserve also believes the economy will recover relatively quickly given the country entered the pandemic on strong economic footing.
There is every reason to believe that the economic rebound, when it comes, can be robust.
—Jerome Powell, U.S. Federal Reserve Chairman
In the meantime, the Federal Reserve says it is committed to providing financing programs and maintaining low interest rates to help boost the economy.
Spotting Opportunity
As the pandemic subsides, broad-based stimulus will be critical for economic recoveries. Clear communication on the state of the pandemic, and the decline of new infections, will also help instill consumer confidence.
Investors can consider these factors, as well as the IMF’s forecast, as they look to diversify geographically. This allows investors to take advantage of areas with the highest potential growth.


Markets in a Minute
The Top 5 Reasons Clients Fire a Financial Advisor
Firing an advisor is often driven by more than cost and performance factors. Here are the top reasons clients ‘break up’ with their advisors.

The Top 5 Reasons Clients Fire a Financial Advisor
What drives investors to fire a financial advisor?
From saving for a down payment to planning for retirement, clients turn to advisors to guide them through life’s complex financial decisions. However, many of the key reasons for firing a financial advisor stem from emotional factors, and go beyond purely financial motivations.
We partnered with Morningstar to show the top reasons clients fire an advisor to provide insight on what’s driving investor behavior.
What Drives Firing Decisions?
Here are the top reasons clients terminated their advisor, based on a survey of 184 respondents:
| Reason for Firing | % of Respondents Citing This Reason | Type of Motivation |
|---|---|---|
| Quality of financial advice and services | 32% | Emotion-based reason |
| Quality of relationship | 21% | Emotion-based reason |
| Cost of services | 17% | Financial-based reason |
| Return performance | 11% | Financial-based reason |
| Comfort handling financial issues on their own | 10% | Emotion-based reason |
Numbers may not total 100 due to rounding. Respondents could select more than one answer.
Numbers may not total 100 due to rounding. Respondents could select more than one answer.
While firing an advisor is rare, many of the primary drivers behind firing decisions are also emotionally driven.
Often, advisors were fired due to the quality of the relationship. In many cases, this was due to an advisor not dedicating enough time to fully grasp their personal financial goals. Additionally, wealthier, and more financially literate clients are more likely to fire their advisors—highlighting the importance of understanding the client.
Key Takeaways
Given these driving factors, here are five ways that advisors can build a lasting relationship through recognizing their clients’ emotional needs:
- Understand your clients’ deeper goals
- Reach out proactively
- Act as a financial coach
- Keep clients updated
- Conduct goal-setting exercises on a regular basis
By communicating their value and setting expectations early, advisors can help prevent setbacks in their practice by adeptly recognizing the emotional motivators of their clients.
Markets in a Minute
The Top 5 Reasons Clients Hire a Financial Advisor
Here are the most common drivers for hiring a financial advisor, revealing that investor motivations go beyond just financial factors.

The Top 5 Reasons Clients Hire a Financial Advisor
What drives investors to hire a financial advisor?
From saving for a down payment to planning for retirement, clients turn to advisors to guide them through life’s complex financial decisions. However, many of the key reasons for hiring a financial advisor stem from emotional factors, and go beyond purely financial motivations.
We partnered with Morningstar to show the top reasons clients hire a financial advisor to provide insight on what’s driving investor behavior.
What Drives Hiring Decisions?
Here are the most common reasons for hiring an advisor, based on a survey of 312 respondents.
| Reason for Hiring | % of Respondents Citing This Reason | Type of Motivation |
|---|---|---|
| Specific goals or needs | 32% | Financial-based reason |
| Discomfort handling finances | 32% | Emotion-based reason |
| Behavioral coaching | 17% | Emotion-based reason |
| Recommended by family or friends | 12% | Emotion-based reason |
| Quality of relationship | 10% | Emotion-based reason |
Numbers may not total 100 due to rounding. Respondents could select more than one answer.
While financial factors played an important role in hiring decisions, emotional reasons made up the largest share of total responses.
This illustrates that clients place a high degree of importance on reaching specific goals or needs, and how an advisor communicates with them. Furthermore, clients seek out advisors for behavioral coaching to help them make informed decisions while staying the course.
Key Takeaways
With this in mind, here are five ways advisors can provide value to their clients and grow their practice:
- Address clients’ emotional needs early on
- Demonstrate how you can offer support
- Use ordinary language
- Provide education to help clients stay on track
- Acknowledge that these are issues we all face
By addressing emotional factors, advisors can more effectively help clients’ navigate intricate financial decisions and avoid common behavioral mistakes.

The Top 5 Reasons Clients Fire a Financial Advisor

The Top 5 Reasons Clients Hire a Financial Advisor

Visualizing the Growth of $100, by Asset Class

How Small Investments Make a Big Impact Over Time

What Were the Top Performing Investment Themes of 2023?
-

 Infographics2 years ago
The Top Investment Quotes Every Investor Should Know
-

 Markets in a Minute2 years ago
Mapped: The Growth in U.S. House Prices by State
-

 Markets in a Minute2 years ago
How Closely Related Are Historical Mortgage Rates and Housing Prices?
-

 Infographics2 years ago
A Visual Guide to Stagflation, Inflation, and Deflation
-

 Markets in a Minute1 year ago
Mapped: Global Energy Prices, by Country in 2022
-

 Markets in a Minute2 years ago
Visualizing Historical Oil Prices (1968-2022)
-

 Infographics1 year ago
Visual Guide: The Three Types of Economic Indicators
-

 Markets in a Minute2 years ago
Mapped: Global Macroeconomic Risk, by Country in 2022
