
Markets in a Minute
Black Swan Events: Short-term Crisis, Long-term Opportunity
This Markets in a Minute chart is available as a poster.
This Markets in a Minute chart is available as a poster.
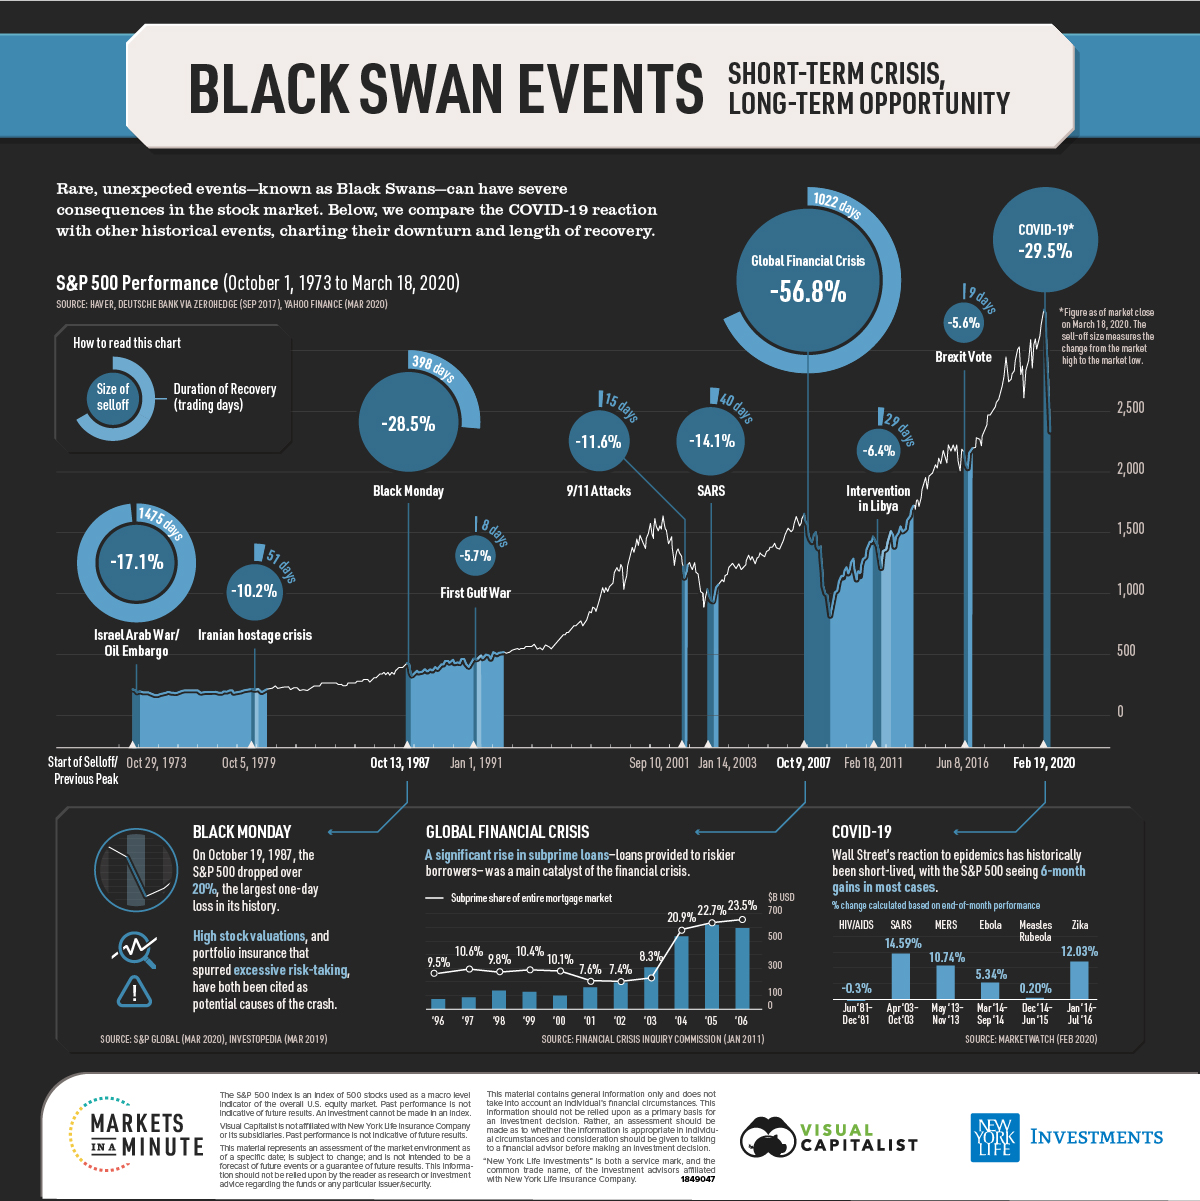
Black Swans: Short-term Crisis, Long-term Opportunity
Few investors could have predicted that a viral outbreak would end the longest-running bull market in U.S. history. Now, the COVID-19 pandemic has pushed stocks far into bear market territory. From its peak on February 19th, the S&P 500 has fallen almost 30%.
While this volatility can cause investors to panic, it’s helpful to keep a long-term perspective. Black swan events, which are defined as rare and unexpected events with severe consequences, have come and gone throughout history. In today’s Markets in a Minute chart from New York Life Investments, we explore the sell-off size and recovery length for some of these events.
Wars, Viruses, and Excessive Valuations
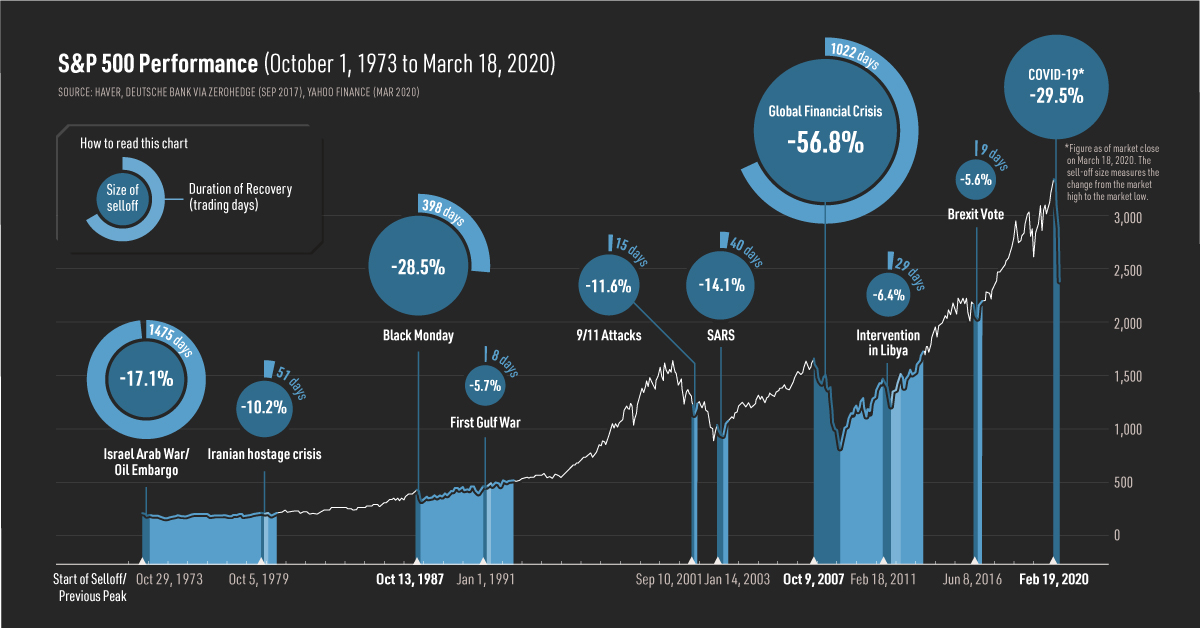
With sell-offs ranging from -5% to -50%, black swan events have all impacted the S&P 500 differently. Here’s a look at select events over the last half-century:
| Event | Start of Sell-off/Previous Peak | Size of Sell-off | Duration of Sell-off (Trading Days) | Duration of Recovery (Trading Days) |
|---|---|---|---|---|
| Israel Arab War/Oil Embargo | October 29, 1973 | -17.1% | 27 | 1475 |
| Iranian Hostage Crisis | October 5, 1979 | -10.2% | 24 | 51 |
| Black Monday | October 13, 1987 | -28.5% | 5 | 398 |
| First Gulf War | January 1, 1991 | -5.7% | 6 | 8 |
| 9/11 Attacks | September 10, 2001 | -11.6% | 6 | 15 |
| SARS | January 14, 2003 | -14.1% | 39 | 40 |
| Global Financial Crisis | October 9, 2007 | -56.8% | 356 | 1022 |
| Intervention in Libya | February 18, 2011 | -6.4% | 18 | 29 |
| Brexit Vote | June 8, 2016 | -5.6% | 14 | 9 |
| COVID-19* | February 19, 2020 | -29.5% | 19 | N/A (ongoing) |
* Figure as of market close on March 18, 2020. The sell-off measures from the market high to the market low.
While the declines can be severe, most have been short-lived. Markets typically returned to previous peak levels in no more than a couple of months. The Oil Embargo, Black Monday, and the Global Financial Crisis are notable outliers, with the recovery spanning a year or more.
After Black Monday, the Federal Reserve reaffirmed its readiness to provide liquidity, and the market recovered in about 400 trading days. Both the 1973 Oil Embargo and 2007 Global Financial Crisis led to U.S. recessions, lengthening the recovery over multiple years.
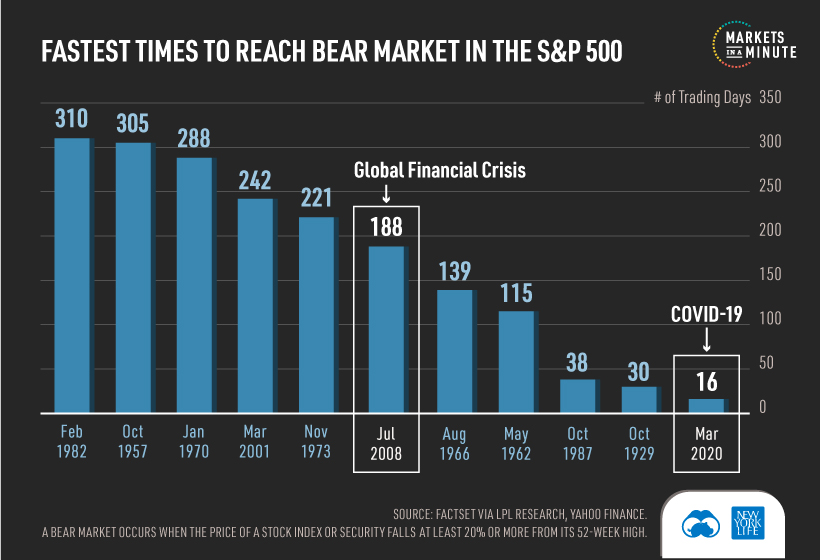
COVID-19: How Long Will it Last?
It’s difficult to predict how long COVID-19 will impact markets, as its societal and financial disruption is unprecedented. In fact, the S&P 500 reached a bear market in just 16 days, the fastest time period on record.
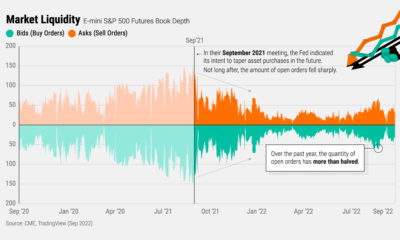
Some Wall Street strategists believe that the market will only begin to recover when COVID-19’s daily infection rate peaks. In the meantime, governments have begun announcing rate cuts and fiscal stimulus in order to help stabilize the economy.
Considering the high levels of uncertainty, what should investors do?
Buy on Fear, Sell on Greed?
Legendary investor Warren Buffet is a big proponent of this strategy. When others are greedy—typically when prices are boiling over—assets may be overpriced. On the flipside, there may be good buying opportunities when others are fearful.
Most importantly, investors need to remain disciplined with their investment process throughout the volatility. History has shown that markets will eventually recover, and may reward patient investors.


Markets in a Minute
The Top 5 Reasons Clients Fire a Financial Advisor
Firing an advisor is often driven by more than cost and performance factors. Here are the top reasons clients ‘break up’ with their advisors.

The Top 5 Reasons Clients Fire a Financial Advisor
What drives investors to fire a financial advisor?
From saving for a down payment to planning for retirement, clients turn to advisors to guide them through life’s complex financial decisions. However, many of the key reasons for firing a financial advisor stem from emotional factors, and go beyond purely financial motivations.
We partnered with Morningstar to show the top reasons clients fire an advisor to provide insight on what’s driving investor behavior.
What Drives Firing Decisions?
Here are the top reasons clients terminated their advisor, based on a survey of 184 respondents:
| Reason for Firing | % of Respondents Citing This Reason | Type of Motivation |
|---|---|---|
| Quality of financial advice and services | 32% | Emotion-based reason |
| Quality of relationship | 21% | Emotion-based reason |
| Cost of services | 17% | Financial-based reason |
| Return performance | 11% | Financial-based reason |
| Comfort handling financial issues on their own | 10% | Emotion-based reason |
Numbers may not total 100 due to rounding. Respondents could select more than one answer.
Numbers may not total 100 due to rounding. Respondents could select more than one answer.
While firing an advisor is rare, many of the primary drivers behind firing decisions are also emotionally driven.
Often, advisors were fired due to the quality of the relationship. In many cases, this was due to an advisor not dedicating enough time to fully grasp their personal financial goals. Additionally, wealthier, and more financially literate clients are more likely to fire their advisors—highlighting the importance of understanding the client.
Key Takeaways
Given these driving factors, here are five ways that advisors can build a lasting relationship through recognizing their clients’ emotional needs:
- Understand your clients’ deeper goals
- Reach out proactively
- Act as a financial coach
- Keep clients updated
- Conduct goal-setting exercises on a regular basis
By communicating their value and setting expectations early, advisors can help prevent setbacks in their practice by adeptly recognizing the emotional motivators of their clients.
Markets in a Minute
The Top 5 Reasons Clients Hire a Financial Advisor
Here are the most common drivers for hiring a financial advisor, revealing that investor motivations go beyond just financial factors.

The Top 5 Reasons Clients Hire a Financial Advisor
What drives investors to hire a financial advisor?
From saving for a down payment to planning for retirement, clients turn to advisors to guide them through life’s complex financial decisions. However, many of the key reasons for hiring a financial advisor stem from emotional factors, and go beyond purely financial motivations.
We partnered with Morningstar to show the top reasons clients hire a financial advisor to provide insight on what’s driving investor behavior.
What Drives Hiring Decisions?
Here are the most common reasons for hiring an advisor, based on a survey of 312 respondents.
| Reason for Hiring | % of Respondents Citing This Reason | Type of Motivation |
|---|---|---|
| Specific goals or needs | 32% | Financial-based reason |
| Discomfort handling finances | 32% | Emotion-based reason |
| Behavioral coaching | 17% | Emotion-based reason |
| Recommended by family or friends | 12% | Emotion-based reason |
| Quality of relationship | 10% | Emotion-based reason |
Numbers may not total 100 due to rounding. Respondents could select more than one answer.
While financial factors played an important role in hiring decisions, emotional reasons made up the largest share of total responses.
This illustrates that clients place a high degree of importance on reaching specific goals or needs, and how an advisor communicates with them. Furthermore, clients seek out advisors for behavioral coaching to help them make informed decisions while staying the course.
Key Takeaways
With this in mind, here are five ways advisors can provide value to their clients and grow their practice:
- Address clients’ emotional needs early on
- Demonstrate how you can offer support
- Use ordinary language
- Provide education to help clients stay on track
- Acknowledge that these are issues we all face
By addressing emotional factors, advisors can more effectively help clients’ navigate intricate financial decisions and avoid common behavioral mistakes.

The Top 5 Reasons Clients Fire a Financial Advisor

The Top 5 Reasons Clients Hire a Financial Advisor

Visualizing the Growth of $100, by Asset Class

How Small Investments Make a Big Impact Over Time

What Were the Top Performing Investment Themes of 2023?
-

 Infographics2 years ago
The Top Investment Quotes Every Investor Should Know
-

 Markets in a Minute2 years ago
Mapped: The Growth in U.S. House Prices by State
-

 Markets in a Minute2 years ago
How Closely Related Are Historical Mortgage Rates and Housing Prices?
-

 Infographics2 years ago
A Visual Guide to Stagflation, Inflation, and Deflation
-

 Markets in a Minute1 year ago
Mapped: Global Energy Prices, by Country in 2022
-

 Markets in a Minute2 years ago
Visualizing Historical Oil Prices (1968-2022)
-

 Infographics1 year ago
Visual Guide: The Three Types of Economic Indicators
-

 Markets in a Minute2 years ago
Mapped: Global Macroeconomic Risk, by Country in 2022
